


 35 / 116

Estimating
irrigated area and water
use from
remote sensing data
T
he estimations of the area of irrigated crops in South Af
rica are currently outdated and vary greatly. Various assess
ments since 1990 documented the area under irrigation,
using different approaches. According to these estimates, the
area under irrigation ranged between 1,21 million ha to 1,58 million ha
and the area registered for irrigation was between 1,44 million ha
and 1,68 million ha.
In order to address the knowledge gap regarding the appropri
ate methodology and obtaining recent empirical evidence of the
irrigated area, a research project was initiated by the Water Re
search Commission (WRC) in 2013, which was co-funded by the
Department of Agriculture, Forestry and Fisheries (DAFF).
The overarching aim of this research project, led by Prof Adriaan
van Niekerk from Stellenbosch University (SU), was therefore to up
date the existing estimations of the area and volume of water used
by irrigated agriculture in South Africa. As stated in the published
WRC report, the project by SU was undertaken with national and
international partners.
Remotely sensed earth observation (EO) data are regularly captured
from a wide variety of aerial and satellite platforms. The wide cover
age and cost-effective nature of earth observation images are not
only ideal for determining the area under irrigated agriculture, but
have for many years been employed in energy balance modelling to
provide up-to-date estimates of actual evapotranspiration (ET) and
the total volume of water utilised by irrigated agriculture.
A literature review of existing methods confirmed that earth obser
vation is the only viable approach to use for national assessments.
This research consequently applied various earth observation and
geographical information systems (GIS) techniques, including the
mapping of irrigated agriculture and the modelling of actual evapo
transpiration.
Monthly datasets of evapotranspiration for a twelve-month period
were generated for the entire South Africa. The evapotranspiration
datasets describe the water consumption and crop production on
land between 1 August 2014 and 31 July 2015 and thus capture the
phenology of vegetation, crop production cycles and associated wa
ter consumption in South Africa. The generation of the irrigated area
map and the calculation of the total water use by irrigated crops were
informed by these datasets.
33
October 2018
FoCus
Irrigation
Dr Gerhard Backeberg,
executive manager: Water Utilisation in Agriculture, Water Research Commission
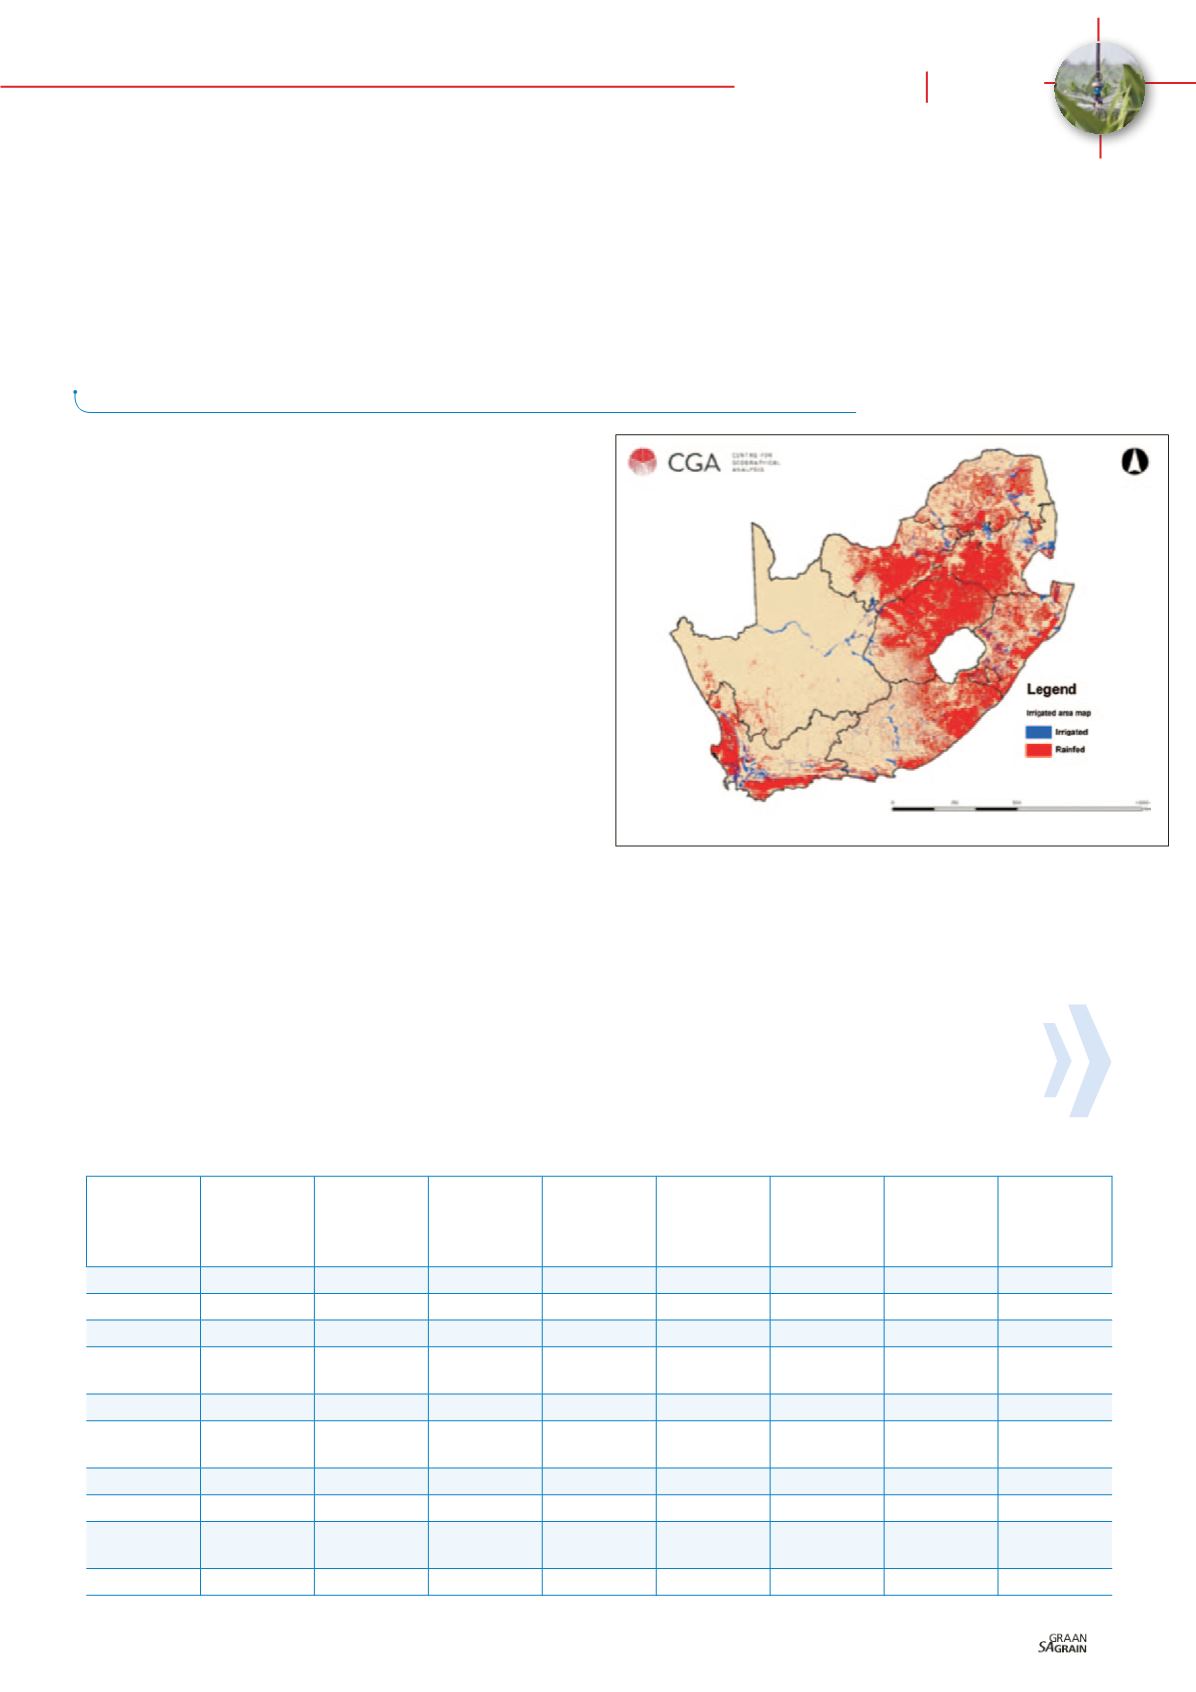
Figure 1: Map of irrigated areas.
REGION
TOTAL AREA
(HA)
CULTIVATED
AREA (HA)
IRRIGATED
AREA (HA)
IRRIGATED
AREA (%
OF TOTAL
AREA)
IRRIGATED
AREA (% OF
CULTIVATED
AREA)
ET (MILLION
M
3
/YEAR)
ET* (M
3
/HA)
ET* (% OF
TOTAL USE)
Eastern Cape
16 896 600 1 355 239
152 866
0,90
11,30
1 070
7 000
10,50
Free State
12 982 520 3 796 784
129 077
0,99
3,40
832
6 446
8,10
Gauteng
1 817 831
405 056
20 115
1,11
5,00
154
7 656
1,50
KwaZulu-
Natal
9 436 132 1 428 847
177 341
1,88
12,40
1 518
8 560
14,90
Mpumalanga
7 649 469 1 306 403
125 595
1,64
9,60
1 245
9 913
12,20
Northern
Cape
37 288 940
272 079
144 579
0,39
53,10
1 135
7 850
11,10
Limpopo
12 575 390 1 251 682
218 302
1,74
17,40
1 930
8 841
18,90
North West
10 488 170 2 183 704
97 211
0,93
4,50
752
7 736
7,40
Western
Cape
12 946 220 1 947 345
269 476
2,08
13,80
1 583
5 874
15,50
National
122 081 272 13 947 139 1 334 562
1,09
9,57
10 221
7 659
100,00
Table 1: Water use by irrigated agriculture, expressed nationally and per province for the 2014/2015 period.
*ET = evapotranspiration