


 30 / 116

Oktober 2018
28
Focus
Irrigation
V6
High quality information provided by ECa
measurements, laboratory data and geo-
statistical software can be used for ultra-
precision soil and water management:
Topography
: State of the art GPS tech
nology, accurate to 1 cm, makes quality
elevation, surface drainage and slope
maps possible. This is important for
the management of surface runoff, in
ternal and external drainage (
Figure 1
on
page 27).
Soil classification
: Since the identified
soil point represents 95% of the vari
ation in the field, soils at these points
need to be classified and their physi
cal conditions interpreted concerning
drainage, storage and root development
(
Figure 2
on page 27).
Waterlogging and salinity manage-
ment
: Salinity is an important, yet ne
glected soil property. Salinity reduces
crop yield through an osmotic (drought)
effect and sodicity causes dispersion of
soil clays, soil structure degradation and
waterlogging – an important aspect for
irrigation producers (
Figure 3
and
Fig-
ure 4
on page 27).
Soil water storage
: The soil water
storage capacity can be determined
over the whole field using measured
physical soil properties as well as soil
depth. Identification of water manage
ment zones guides the installation and
calibration of soil water probes. With
this knowledge irrigation can be done
more effectively (
Figure 5
on page 27).
Fertility management
: Using the op
timal levels of nutrients in the soil as a
guide, fertility management zones can
be identified. Recommendations are
made to rectify imbalances in addition
to the crop requirement (
Figure 6
on
page 27).
Ultra-precision in ground truthing of soil
properties is now a reality through EMI
technology. For more information on the
field services (EMI survey), taking of soil
samples, soil classification, analysis of soil
fertility and soil physical properties, and
data visualisation in the form of attribute
maps, contact Lindi Smit at 076 897 1512 or
vanslab.africa@gmail.com
.
References
Amezketa, E, 2007.
Soil salinity assessment using di-
rected soil sampling from a geophysical survey with
electromagnetic technology
: A case study. Spanish
Journal of Agricultural Research, 5(1): 91 - 101.
Corwin, DL, Kaffka, SR, Hopmans, JW, Mori, Y, Van
Groenigen, JW, Van Kessel, C, Lesch, SM and Oster,
JD. 2003a.
Assessment and field-scale mapping of
soil quality properties of a saline-sodic soil
. Geoder
ma, 114: 231 - 259.
Corwin, DL and Lesch, SM. 2005.
Apparent soil elec-
trical conductivity measurements in agriculture
. Com
puters and Electronics in Agriculture, 46: 11 - 43.
Ultra-precision ground truthing
V1
0 mm - 300 mm
300 mm - 750 mm
750 mm - 1 500 mm
V2 V3
V4
V5
V1
0 mm - 300 mm
300 mm - 750 mm
750 mm - 1 500 mm
V2 V3 V4
V5 V6
3a
3b
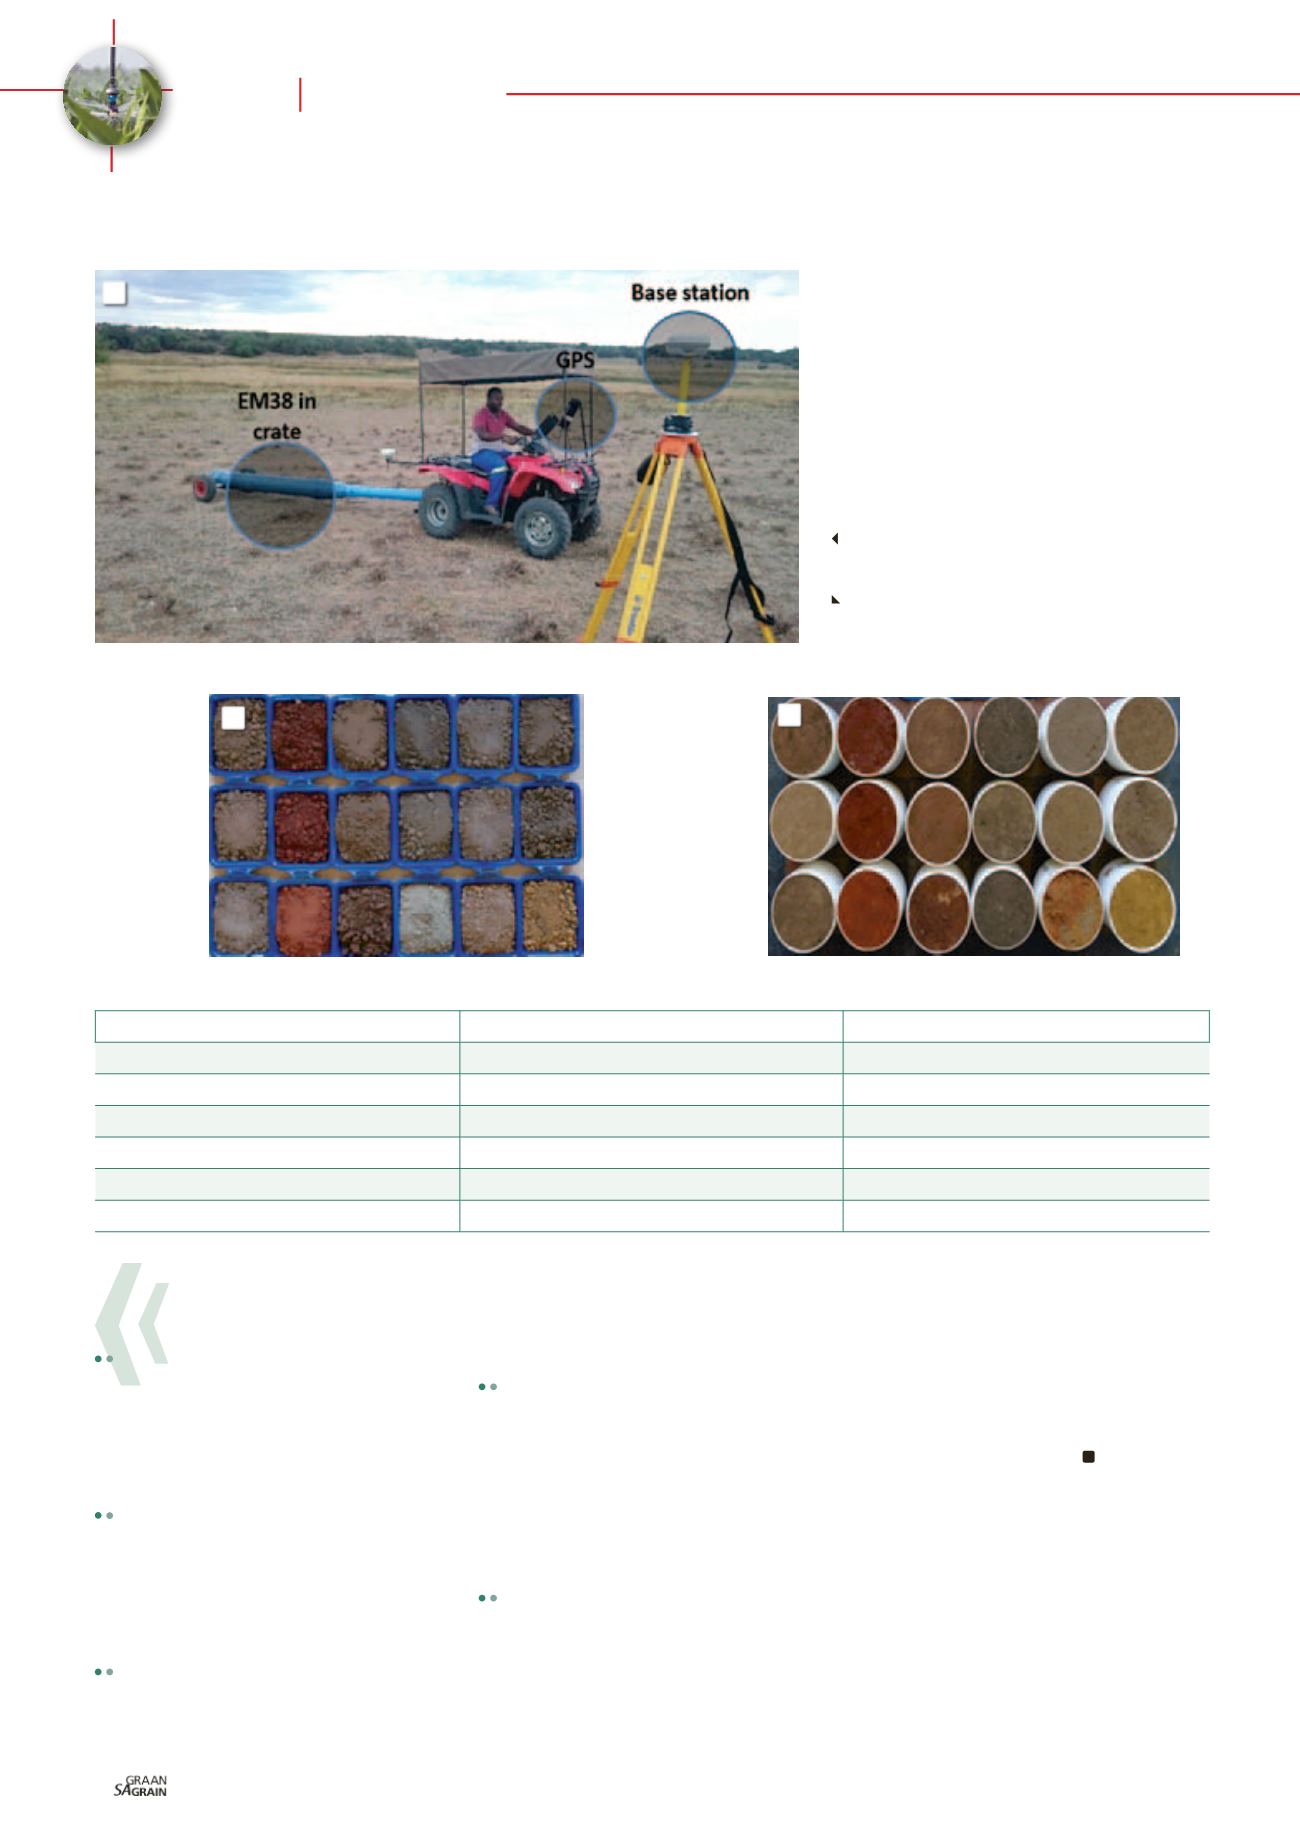
2: Mobile sensor unit with EM38 sensor in
a cart, GPS system and base station that
enhances accuracy.
3a and 3b: Disturbed and undisturbed soil
samples.
CROP
TRANSECT SPACING (M)
ECA SURVEY DENSITY
Wine grapes
5
One measurement per 8,1 m²
Wine grapes
5
One measurement per 9,3 m²
Pecan nuts
12
One measurement per 17,5 m²
Lucerne
10
One measurement per 17,6 m²
Irrigated maize
25
One measurement per 43,1 m²
Dryland maize
30
One measurement per 79 m²
Table 1: Examples of EM field survey densities.
2