


 82 / 112

Oktober 2015
80
RELEVANT
A look at the sunflower crop quality
of the 2013/2014 production season
D
uring the 2014 harvesting season, a representative sample
of each delivery of sunflowers at the various silos was
taken according to the prescribed grading regulations. Of
the 176 samples analysed for the purpose of this second
annual survey, 82% (145) were graded as grade FH1, and 31 of the
samples were downgraded to class other sunflower seed (COSF).
This percentage of FH1 samples compares well with the 80% of the
2012/2013 season.
The major factors responsible for downgrading 68% of the
31 samples mentioned above, were the percentages screenings
or Sclerotinia and as a result the percentage collective deviations
exceeding the maximum permissible deviations of 4% (both
screenings and Sclerotinia) and 6% respectively.
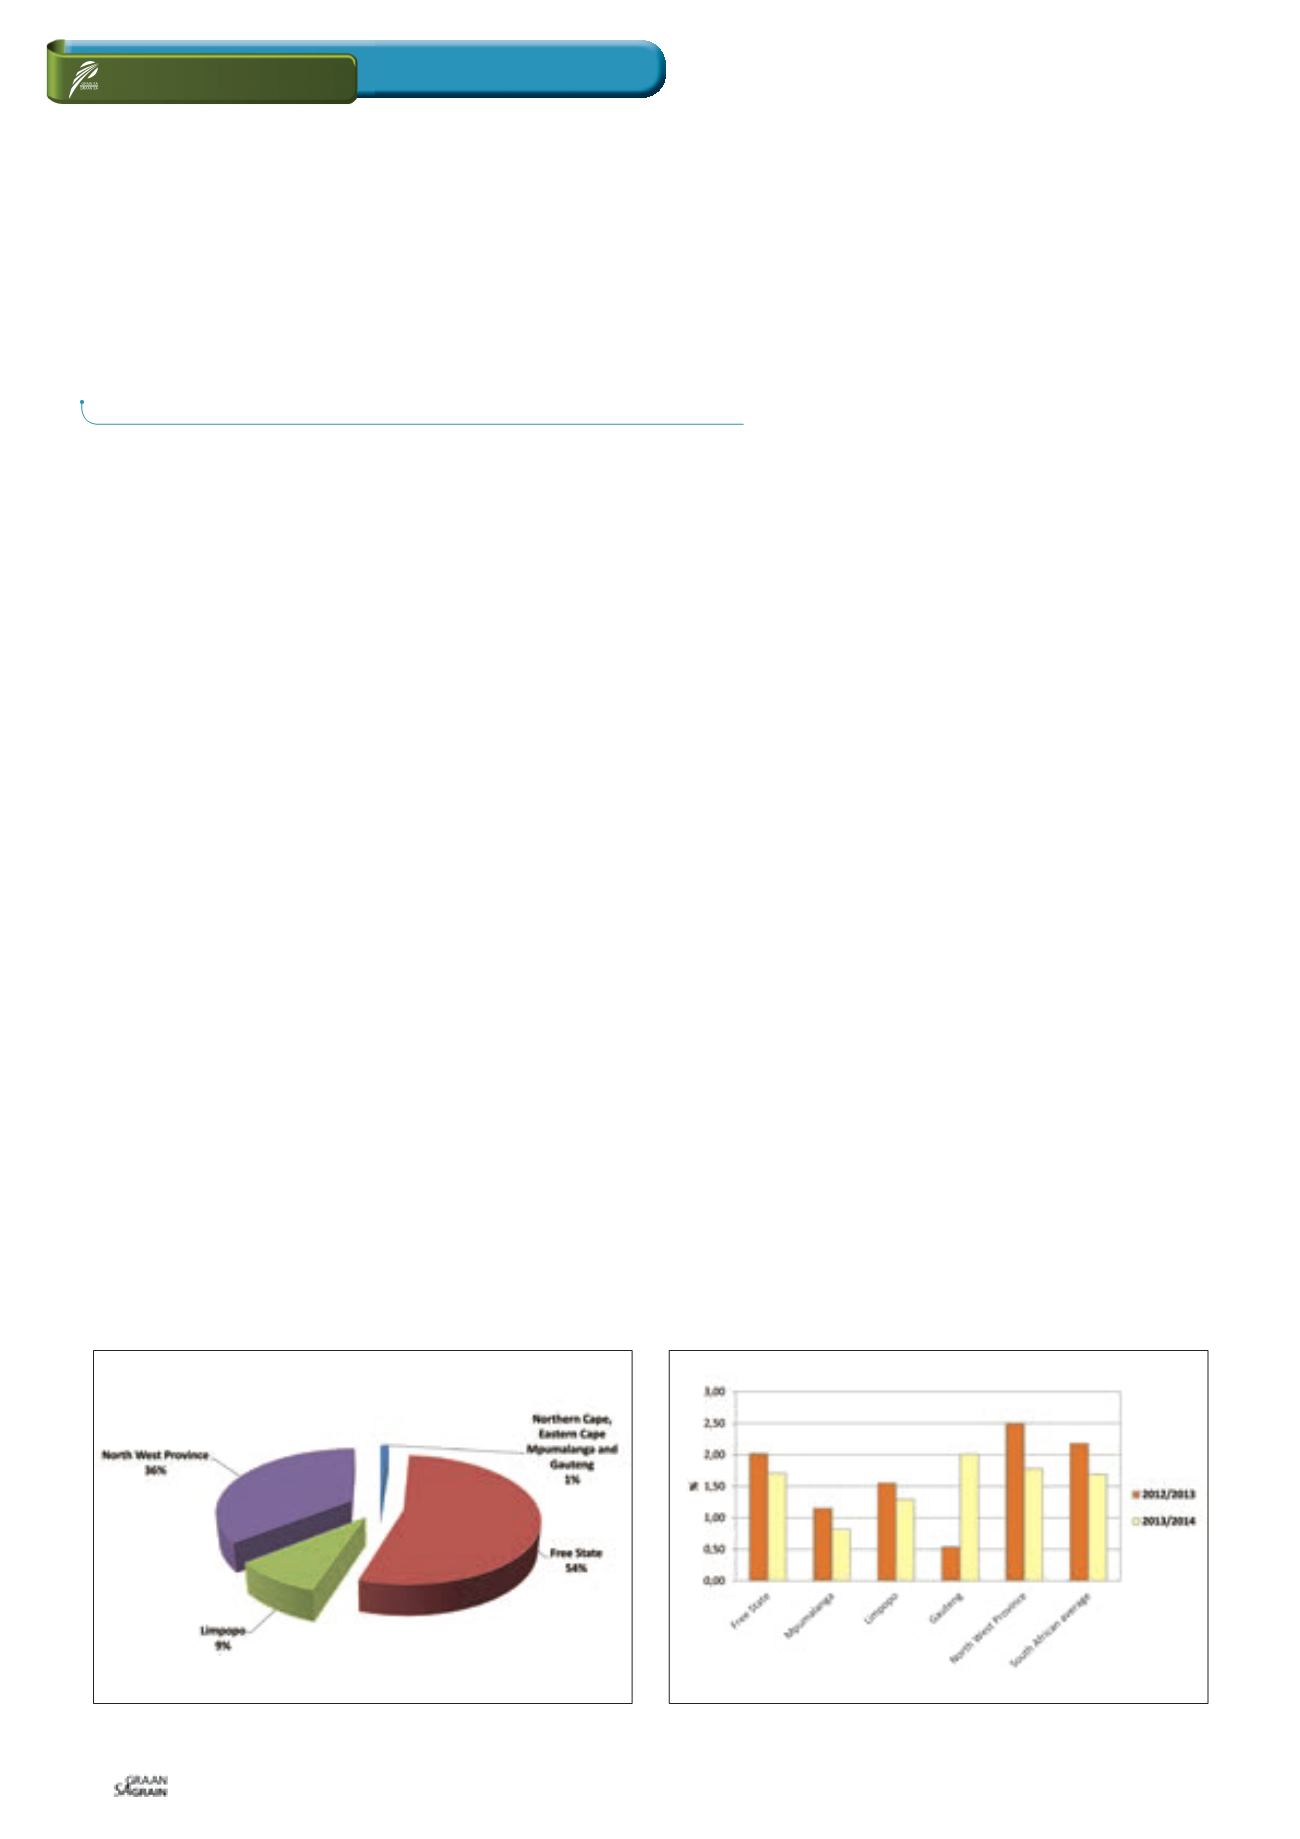
Gauteng (four samples) reported the highest weighted average
percentage screenings namely 2,01%, followed by the North West
Province (N = 58) and Free State (N = 98) with 1,78% and 1,71%
respectively. Mpumalanga (five samples) reported the lowest
average percentage screenings of 0,82%.
Sclerotinia was not observed on any of the eleven samples from
Limpopo. The samples from the Free State had the lowest weighted
average percentage of Sclerotinia, namely 0,08%. Mpumalanga
had the highest percentage of 1,35%, closely followed by the North
West Province with 1,33%. During the 2012/2013 season, Scleroti-
nia was observed in the North West Province (weighted average of
0,02%) and one region in the Free State (average 0,01%).
In the 2012/2013 season, Sclerotinia was found in only four samples,
three from the North West Province and one from the Free State.
The percentages of Sclerotinia present were well below the
maximum permissible level of 4%.
The highest weighted percentage foreign matter (1,63%) was
reported for the four Gauteng samples. The Free State and North
West Province averaged 1,46% and 1,35% respectively. The lowest
average percentage was found in Limpopo at 0,89%.
Although hectolitre mass does not form part of the grading
regulations for sunflower seed in South Africa, an approximation of
the hectolitre mass of South African sunflower seeds over the last
two seasons, is provided in
Table 1
for information purposes.
The g/1 L filling weight of sunflower seed was determined by means
of the Kern 222 apparatus. The hectolitre mass was extrapolated
by means of the following formulas obtained from the Test Weight
Conversion Chart for Sunflower Seed Oil of the Canadian Grain
Commission: y = 0,1936x + 2,2775 (138 to 182 g/0,5 L) and y =
0,1943x + 2,1665 (183 to 227 g/0,5 L).
After consultation with the industry, it was decided to report
the crude protein, fat, fibre and ash components as a percentage
(g/100 g) on an “as received” or “as is” basis. The average crude
protein content of the 2013/2014 season was 16,15%, 0,62% lower
than the 16,77% of the previous season. Limpopo showed the
highest weighted average crude protein content of 16,95% and
Mpumalanga the lowest, with 15,07%. The North West Province
and the Free State had protein contents of 16,49% and 15,95%
respectively.
The average crude fat percentage increased from 39,2% in
2012/2013, to 39,6% this season. Gauteng had the highest weight-
ed average crude fat content of 42,5%. The lowest average fat
contents were observed in the North West Province (38,8%) and the
Free State (39,7%).
The weighted average percentage of crude fibre increased slightly
from 20% to 20,2% and varied between 18,6% in Limpopo and
20,6% in the North West Province. The weighted average ash
content is comparable, 2,66% this season and 2,54% last season,
varying 0,16% on average between provinces (Gauteng the lowest
and the Free State the highest).
Detailed results of this survey as well as that of the previous season
are available on the SAGL website (
www.sagl.co.za ). The annual
crop quality reports in PDF-format are also available for download
from the website.
JOLANDA NORTJÉ,
manager: Laboratory, The Southern African Grain Laboratory NPC
Graph 1: Contribution of the provinces to the production of the 2013/2014
sunflower crop.
Graph 2: Average percentage screenings per province over two seasons.