


 83 / 112

81
October 2015
With gratitude to the Oil and Protein Seed Development Trust for financial support
of these annual surveys and to the members of Agbiz Grain and DAFF inspectors
for providing the samples.
PROVINCE
HECTOLITRE MASS, KG/HL
2013/2014 SEASON
2012/2013 SEASON
WEIGHTED
AVERAGE
RANGE
NO OF
SAMPLES
WEIGHTED
AVERAGE
RANGE
NO OF
SAMPLES
* Free State (Regions 21 - 28)
41,8
36,4 - 48,2
96
43,8
38,3 - 47,7
58
Mpumalanga (Regions 29 - 33)
37,6
35,0 - 42,2
5
42,5
38,1 - 45,7
6
Limpopo (Region 35)
42,4
37,7 - 44,0
11
44,6
42,6 - 47,5
9
Gauteng (Region 34)
42,8
41,7 - 44,6
4
42,7
42,6 - 42,8
2
North West Province (Region 12 - 20)
40,2
31,1 - 46,6
58
43,0
31,5 - 47,3
77
South Africa
41,3
22,6 - 48,2
174
43,4
31,5 - 47,7
152
* Two samples of the 2013/2014 season with outlier values as a result of deviations (screenings + Sclerotinia + foreign matter) exceeding 18%,
was not taken into account for calculation purposes
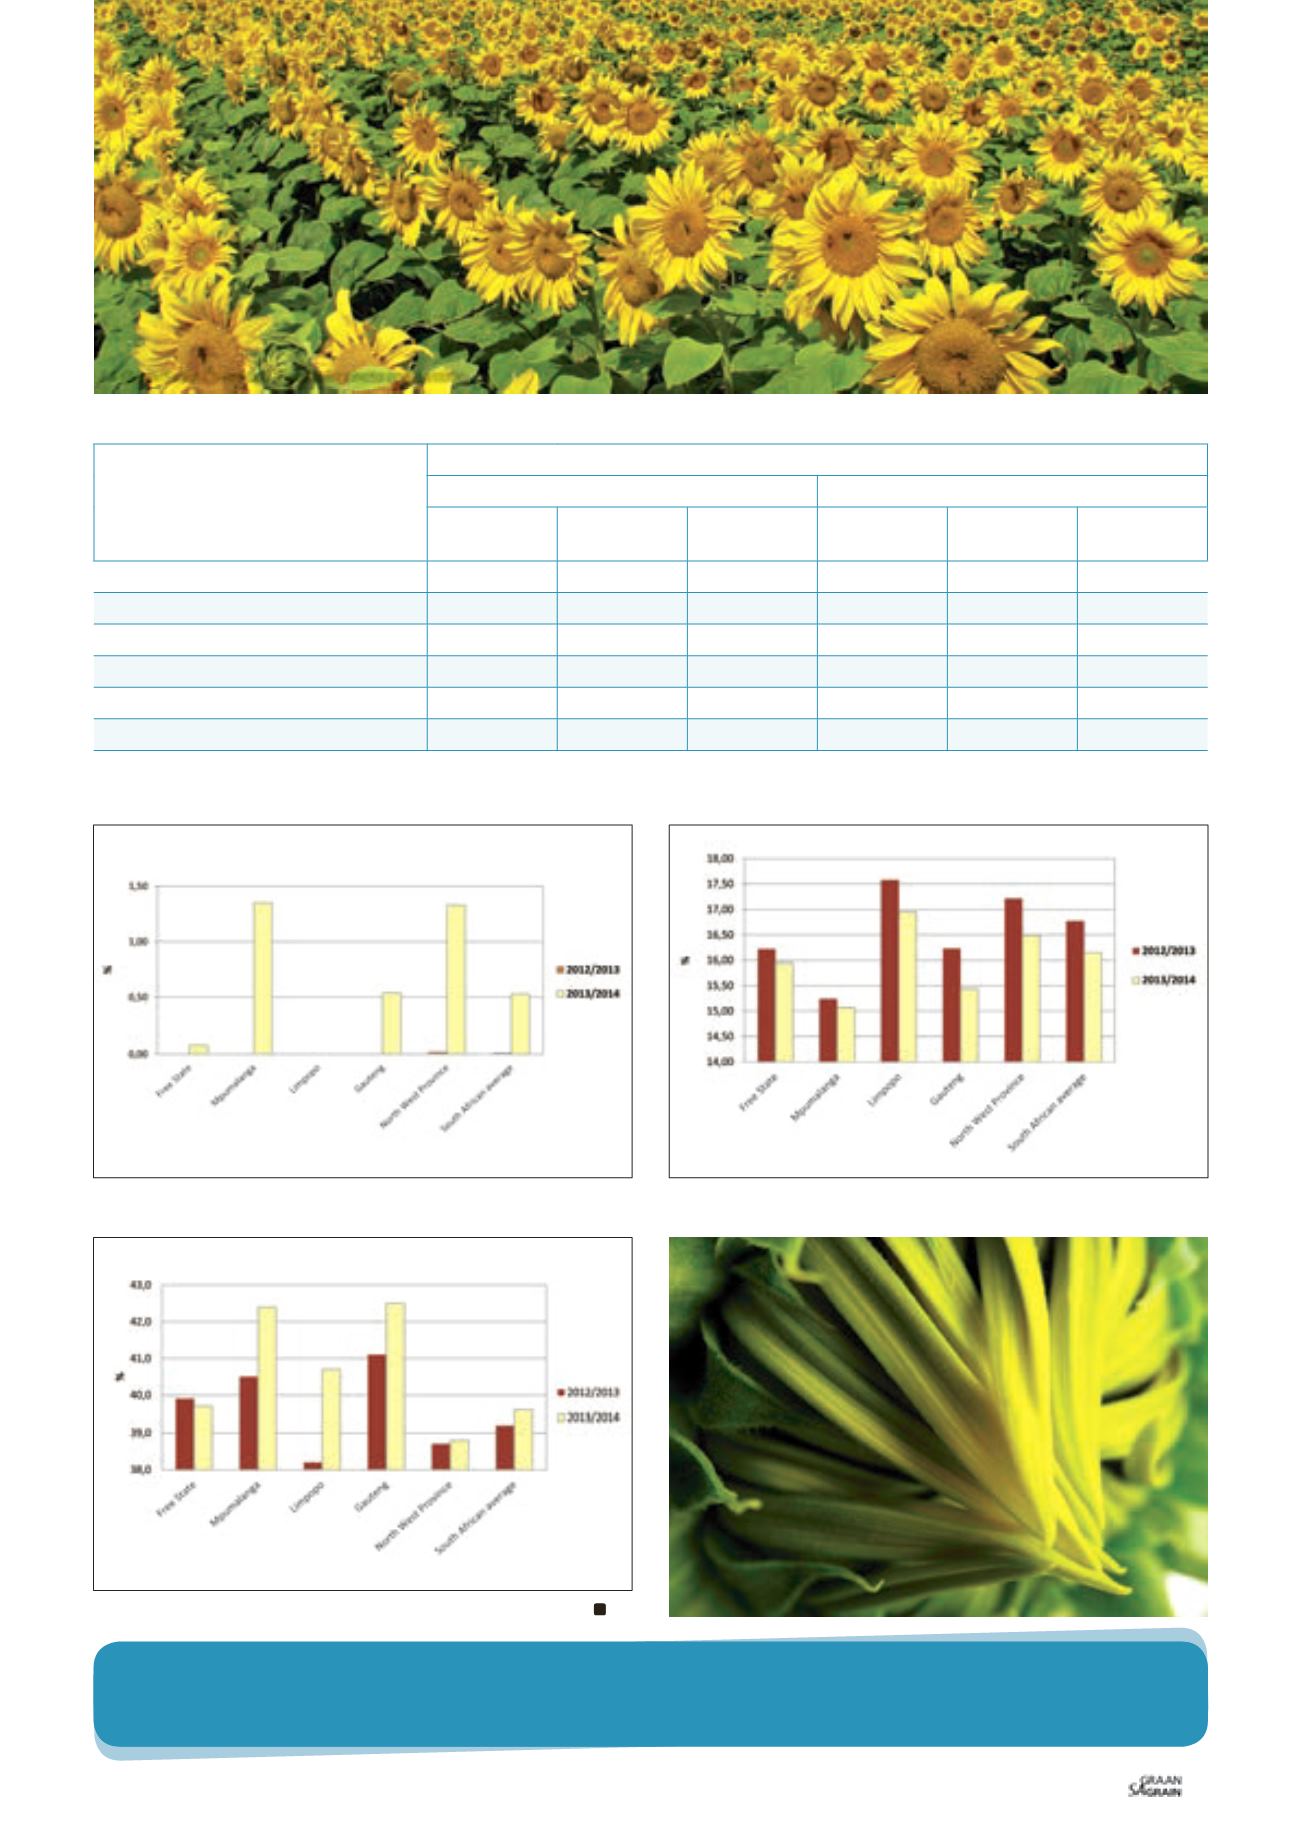
TABLE 1: APPROXIMATION OF HECTOLITRE MASS PER PROVINCE FOR THE 2013/2014 AND 2012/2013 SEASONS.
Graph 3: Average percentage Sclerotinia per province over two seasons.
Graph 5: Average crude fibre content per province over two seasons.
Graph 4: Average crude protein content per province over two seasons.
SA Grain/
Sasol Chemicals (Fertiliser) photo competition
SA Grain/
Sasol Chemicals (Fertiliser) photo competition