


 61 / 112

2015/IMAIZE/A/05A
www.pannar.com infoserve@pannar.co.za® Geregistreerde handelsmerke van PANNAR BPK, © 2014 PANNAR BPK
Saam boer ons
vir die toekoms
™
Kies PANNAR se besproeiingsbasters vir buitengewone
resultate. Ons bied ook ’n verskeidenheid praktiese
boerderyoplossings en koste-effektiewe bestuur-
praktyke. Ons YIELDBOOST
™
swam- en
insekdoderspuitprogramme bied byvoorbeeld ’n
omvattende koste-effektiewe risikobestuurspakket
om die beste moontlike winspotensiaal vir jou
onderneming te bied.
Boere wat die
beste verwag,
kies die beste.
ULTRAMODERNE
NAVORSINGEN
ONTWIKKELINGSTEGNOLOGIE
GEWASVOORSORG
PRESISIE-
BEPLANNING
GEWASBESKERMINGS-
BESTUURSPRAKTYKE
59
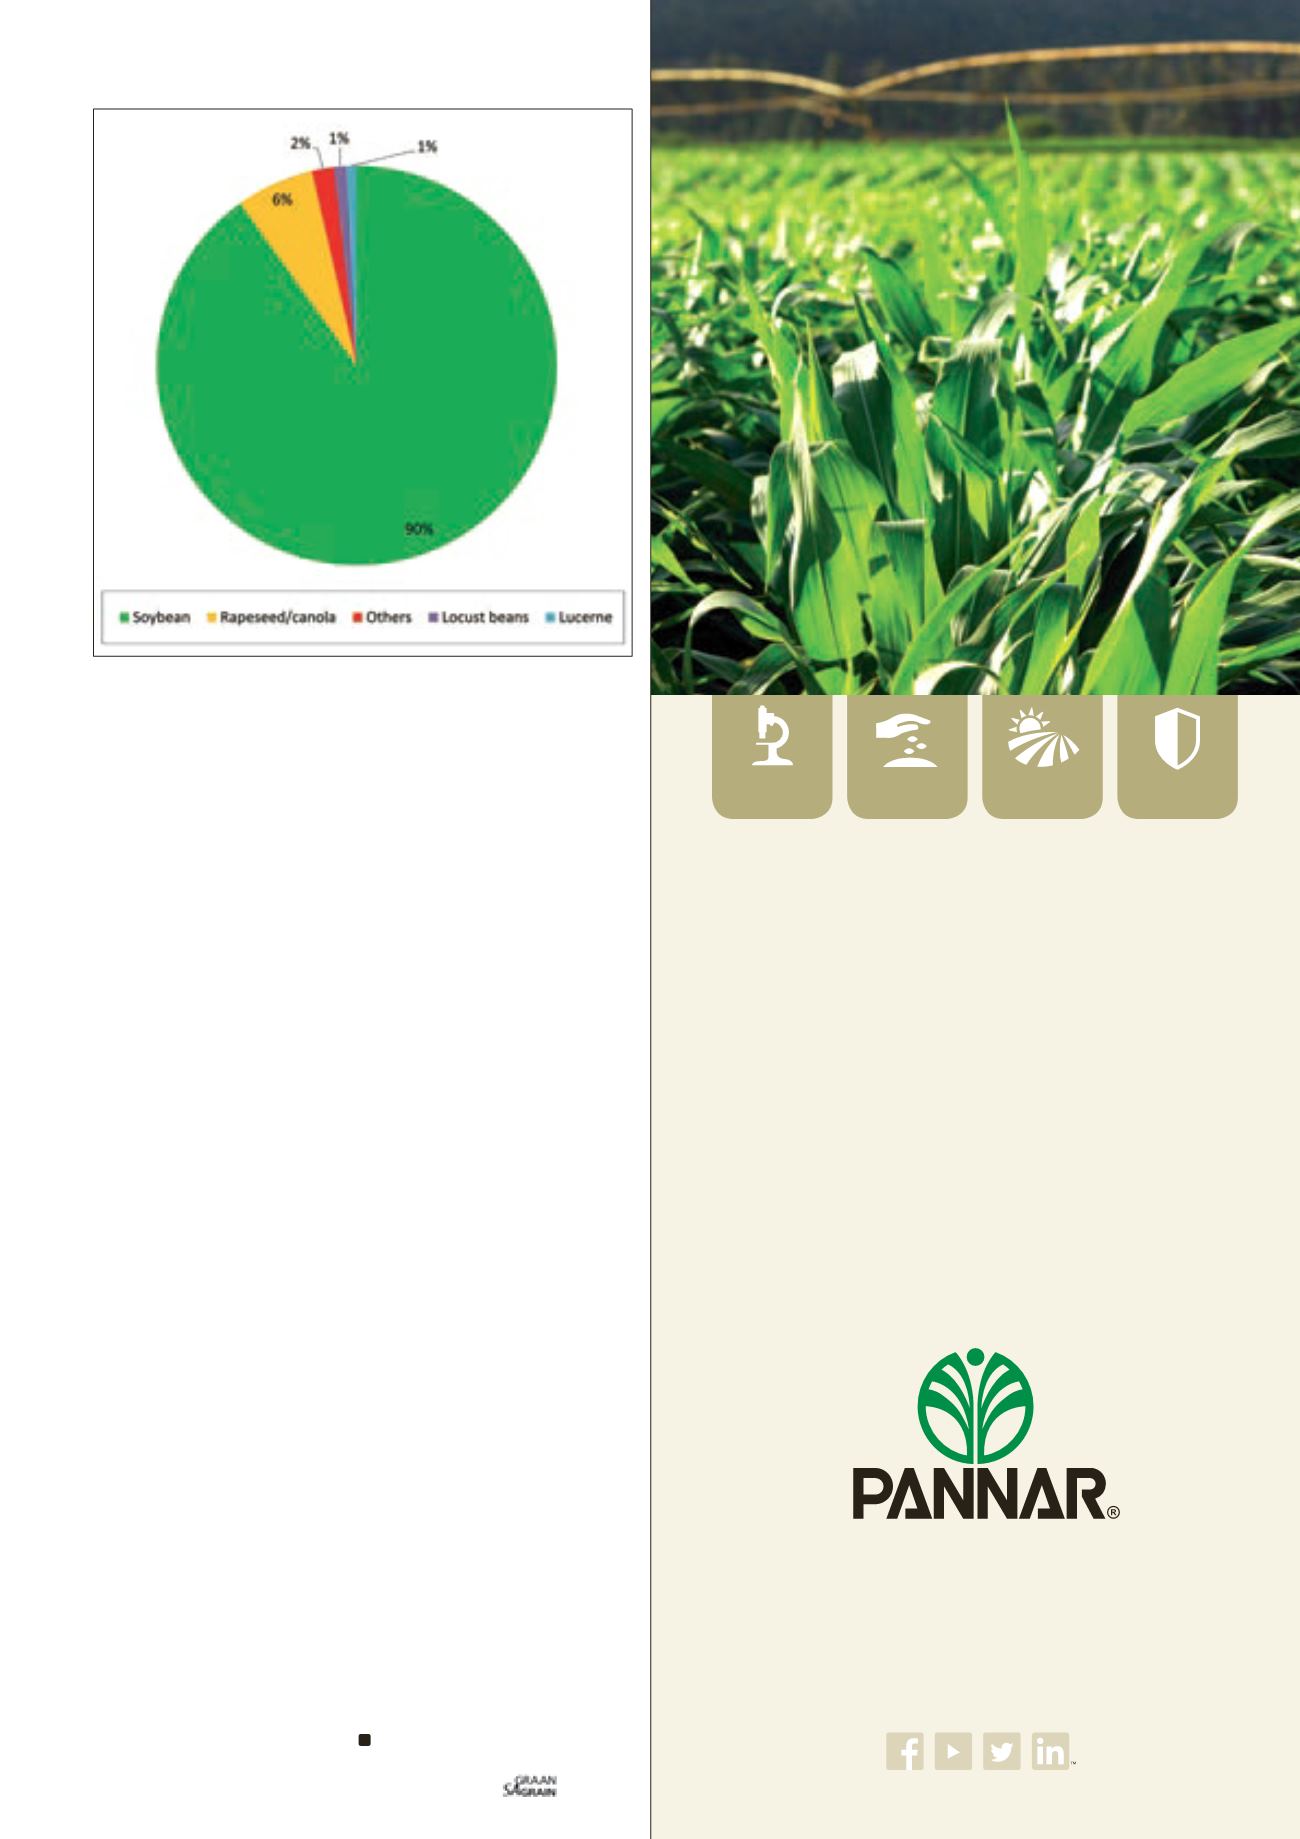
Soybean is the largest imported commodity, accounting for 90%
(71,4 million tons) of imported oilseeds in 2014.
Graph 4
illustrates
Chinese oilseed imports by product in 2014.
The second largest imported commodity in 2014 was canola
(rapeseed), accounting for 6% (5,08 million tons) of the oilseed
market. The third and fourth largest imported commodities were
locust beans and lucerne, both accounting for 1% (1 348 496 tons
and 1 007 446 tons, respectively). Chinese sunflower seed im-
ports accounted for a mere 62 385 tons, followed by groundnuts im-
ports of 29 886 tons.
Concluding remarks
The above presented the significance of China in the oilseed
and grain markets. Given the share of this country in the global
market, it is reasonable to be concerned about their future demand
should the economic slowdown affect consumption.
A decrease in Chinese demand would add pressure on global
cereal and oilseed prices which in turn might influence local prices,
and consequently our local producers. Indications thus far show
that the soft commodities demand in China is mixed.
On the one hand, the United States Department of Agriculture’s
September 2015 World Agricultural Supply and Demand Esti-
mates showed increased Chinese 2015/2016 soybean imports,
which are expected to reach 79 million tons – this is higher than
the 2014 estimate of 71 million tons.
On the other hand, the same report points to comparatively low-
er 2015/2016 Chinese maize imports – which are forecasted at
1,5 million tons, compared to the 2014 imports of 2,6 million
tons. The 2015/2016 Chinese wheat imports were forecasted at
2,2 million tons, lower than the previous year’s imports of
2,6 million tons.
However, the decrease in maize and wheat imports is not because
of the economic slowdown, but rather due to an increase in the
domestic production. It is important to note that these estimates
might be revised in the following month and we will continue to
communicate the developments.
Graph 4: Chinese oilseed imports by rand value in 2014.
Source: International Trade Centre (2015)
* Others = Medicinal plants (HS Code: 1211), Linseed (HS Code: 1204),
Sunflower seed (HS Code: 1206), Groundnuts (HS Code: 1202), Cereal straws
(HS Code: 1213), Flour and meals oil seed (HS Code: 1208), Copra
(HS Code: 1203), Hop cones (HS Code: 1210) and Fruit seeds (HS Code: 1209)