


 58 / 92

56
November 2015
FOCUS
Natural resources and energy
Special
Celebrating the International Year of Soils
In addition, this organic matter is either in free form in the soil (i.e.
not chemically or physically bound to soil particles), or it is captured
inside soil aggregates, which can be r leased when aggregates
break up in water. POM is therefore part of the so-called “labile”
or easily decomposable pool of soil organic matter and is the most
vulnerable fraction of organic matter in terms of decomposition by
micro-organisms.
POM can serve as a biological indicator of soil quality since it is a
source of food and/or energy for micro-organisms and soil animals,
while it also provides nutrients for plant growth. It further enhances
soil aggregate stability, water infiltration and soil aeration.
POM is sensitive to soil disturbance and therefore a further indica-
tor of the level of soil disturbance or the predominant cultivation
practices. When changing from conventional tillage to no-till in con-
junction with mulching and crop rotation/cover crops, it is expected
that the POM fraction in the topsoil will gradually increase over time,
although this is dependent on the amount of clay (the more clay,
the easier it is to accumulate POM), water (the drier the soil and the
climate, the slower POM accumulates) and
temperature (the warmer the climate, the
slower POM accumulates).
POM generally decreases with depth in the
soil, mainly due to the larger input of new or-
ganic material to the topsoil through mulch-
ing. This layering is more pronounced under
no-till conditions where the added organic
material remains largely undisturbed in the
soil surface layer where POM is built-up. To
illustrate this point,
Graph 6
shows the car-
bon (mg) contained in 5 g of soil from two dif-
ferent farms in the Ottosdal district. Farm 1
has been under CA for one year and Farm 2
for six years.
The soil from Farm 1 clearly has higher
levels of organic carbon per 5 g of soil com-
pared to Farm 2. There could be many rea-
sons for this, one of which may be the fact
that Farm 1 has a higher clay content (18%)
compared to Farm 2 (8%). However, it is im-
portant to note the difference in the carbon
fractions between the two soils.
On Farm 1, the amount of carbon contained
in POM is the same at both sampling depths,
while on Farm 2 the carbon contained in
POM is clearly higher at 20 cm (1,9 mg C)
than at 40 cm - 50 cm (0,5 mg C). It is clear
that Farm 2, despite having sandy soils, has
built-up POM in the topsoil, due to a build-
up of organic matter inputs through a longer
period of mulching and reduced soil distur-
bance.
Conclusions
All the soil biological indicators described
above were sensitive enough to reflect the
effects of land management on soil health,
which will assist land managers in adapting
to regenerative CA systems. These indica-
tors were able to demonstrate important
factors, such as the role of cover crops in
increasing soil quality; 70% of the cover
crop treatments demonstrated a higher soil
microbial diversity and activity compared
to veld and bare soil treatments, as well as
mono-cropping and short crop rotations
(e.g. maize-soya).
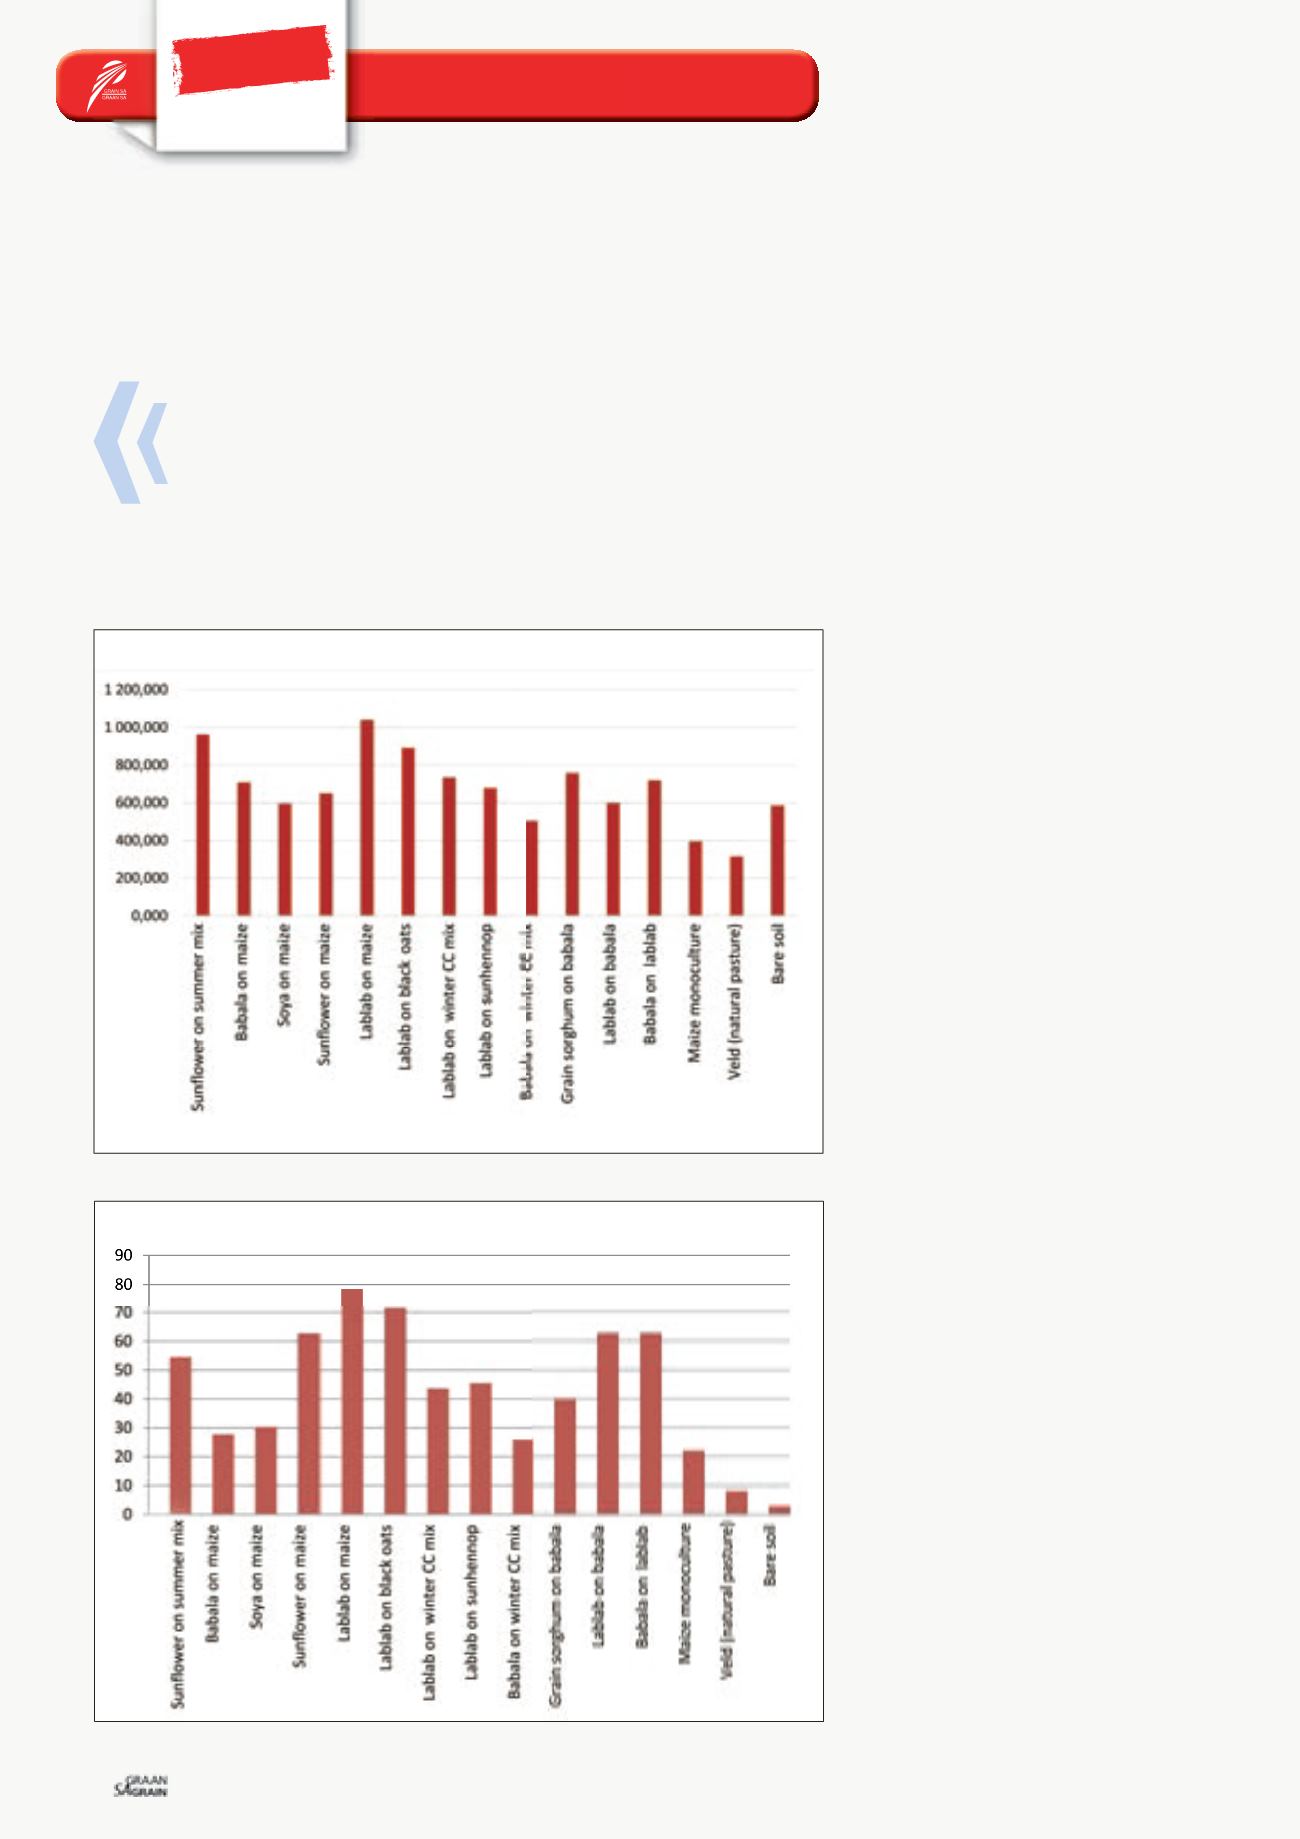
Graph 3: Microbial activity between cover crop treatments.
Graph 4: CO
2
evolution over 24 hours in milligrams, Ottosdal CA project.