


 21 / 44

Disclaimer
Everything has been done to ensure the accuracy of this information, however Grain SA takes no responsibility for
any losses or damage incurred due to the use of this information.
19
December 2016
Conclusion
There are, however, still a few uncertainties in the market ranging
from weather forecasts to the macroeconomic environment – which
can have a severe impact on the prices.
The recent rain that fell in large parts of the country’s maize pro-
ducing areas were sufficient for producers to start with plantings
within the normal planting window – especially towards the eastern
parts of the country. In the more western parts of the country there
are still areas that need some rain in order to start planting, but it
is currently still a bit early in the season and they still have time in
their normal planting window.
One important thing for producers is to identify the possible risks
that may arise during the coming season, whether it is production
or pricewise.
Once one knows what the possible risks are, one can start think-
ing of the different opportunities that arise when managing the
manageable risks. Price risk can largely be managed by hedging or
by means of diversification of crops.
WHITE MAIZE
YELLOW MAIZE
MARKETING YEAR
2017/2018**
LOWER
YIELDS
2017/2018**
AVERAGE
YIELDS
2017/2018**
HIGHER
YIELDS
2017/2018**
LOWER
YIELDS
2017/2018**
AVERAGE
YIELDS
2017/2018**
HIGHER
YIELDS
*Area planted (x 1 000 ha)
1 455
1 455
1 455
1 008
1 008
1 008
**Yields (t/ha)
3,4
4,0
4,4
4,6
4,9
5,4
**Production (x 1 000 ton)
4 947
5 820
6 402
4 637
4 939
5 443
('000 ton)
('000 ton)
('000 ton)
('000 ton)
('000 ton)
('000 ton)
Commercial supply
Opening stocks
558
558
558
723
723
723
***Commercial deliveries
4 862
5 735
6 317
4 292
4 594
5 098
Imports
120
0
0
1 710
820
0
Total commercial supply
5 540
6 293
6 875
6 725
6 137
5 821
Commercial demand
Commercial consumption
4 300
4 970
5 490
5 380
4 860
4 410
Total RSA commercial
consumption
4 406
5 076
5 596
5 690
5 170
4 720
Exports
580
580
580
350
350
540
Total commercial demand
4 986
5 656
6 176
6 040
5 520
5 260
Ending stocks (30 April 2018)
554
637
699
685
618
562
Pipeline requirements
(1,5 months)
538
621
686
673
608
551
Surplus above pipeline
17
16
13
13
10
11
Ending stocks as % of RSA
consumption
13%
13%
12%
12%
12%
12%
TABLE 1: POSSIBLE SUPPLY AND DEMAND SCENARIOS FOR THE 2017/2018 MARKETING SEASON.
*CEC first intentions to plant estimates
**Estimated yield and production possibilities for the 2017/2018 marketing season
***Includes deductions of estimated retentions
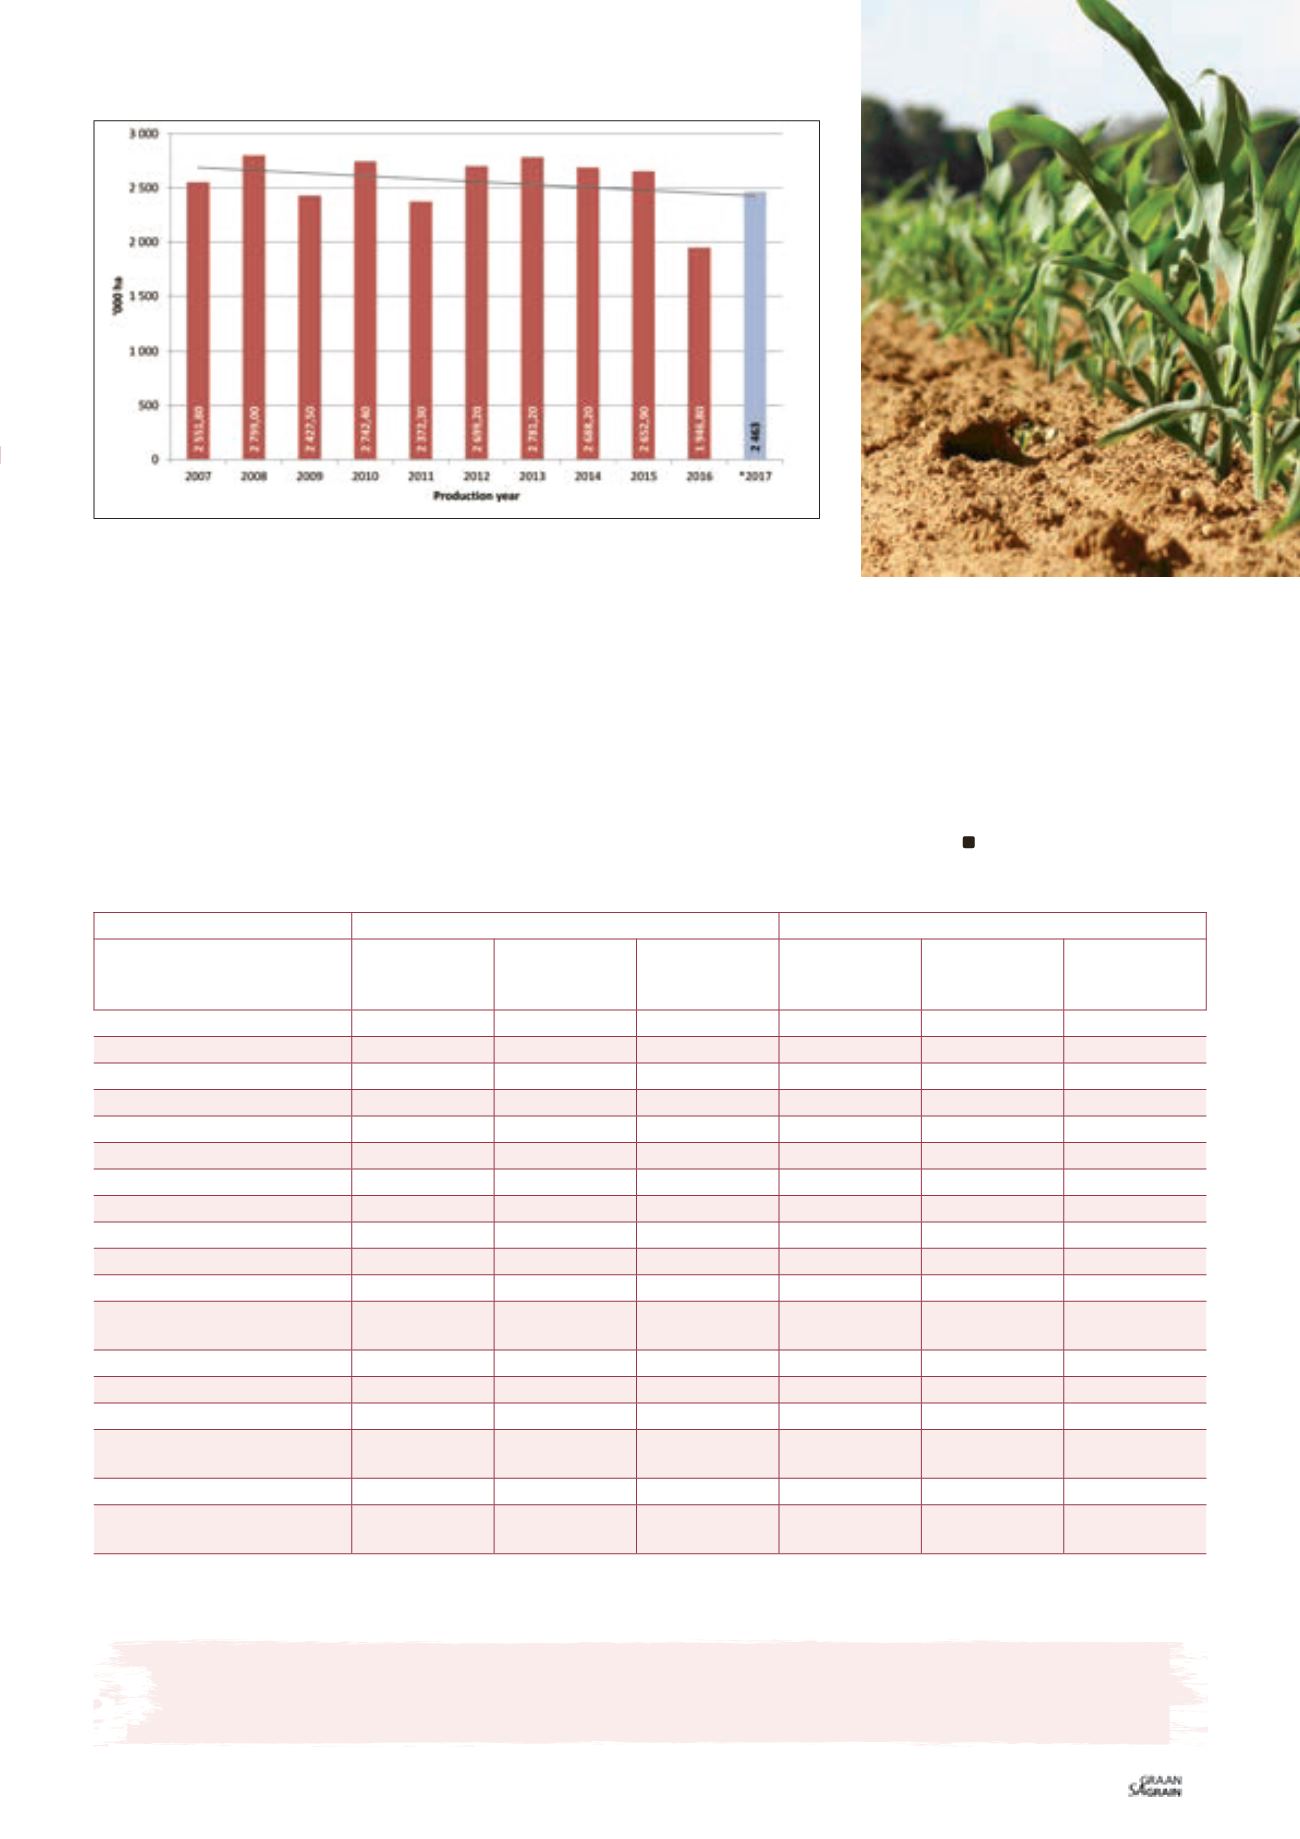
Graph 1: Total area planted to maize in South Africa.
*Intention to plant estimate
Source: Grain SA
Grain SA/Sasol photo competition
– Enrico Cronje 2011