


 70 / 116

Augustus 2015
68
ON FARM LEVEL
Consumption perspective
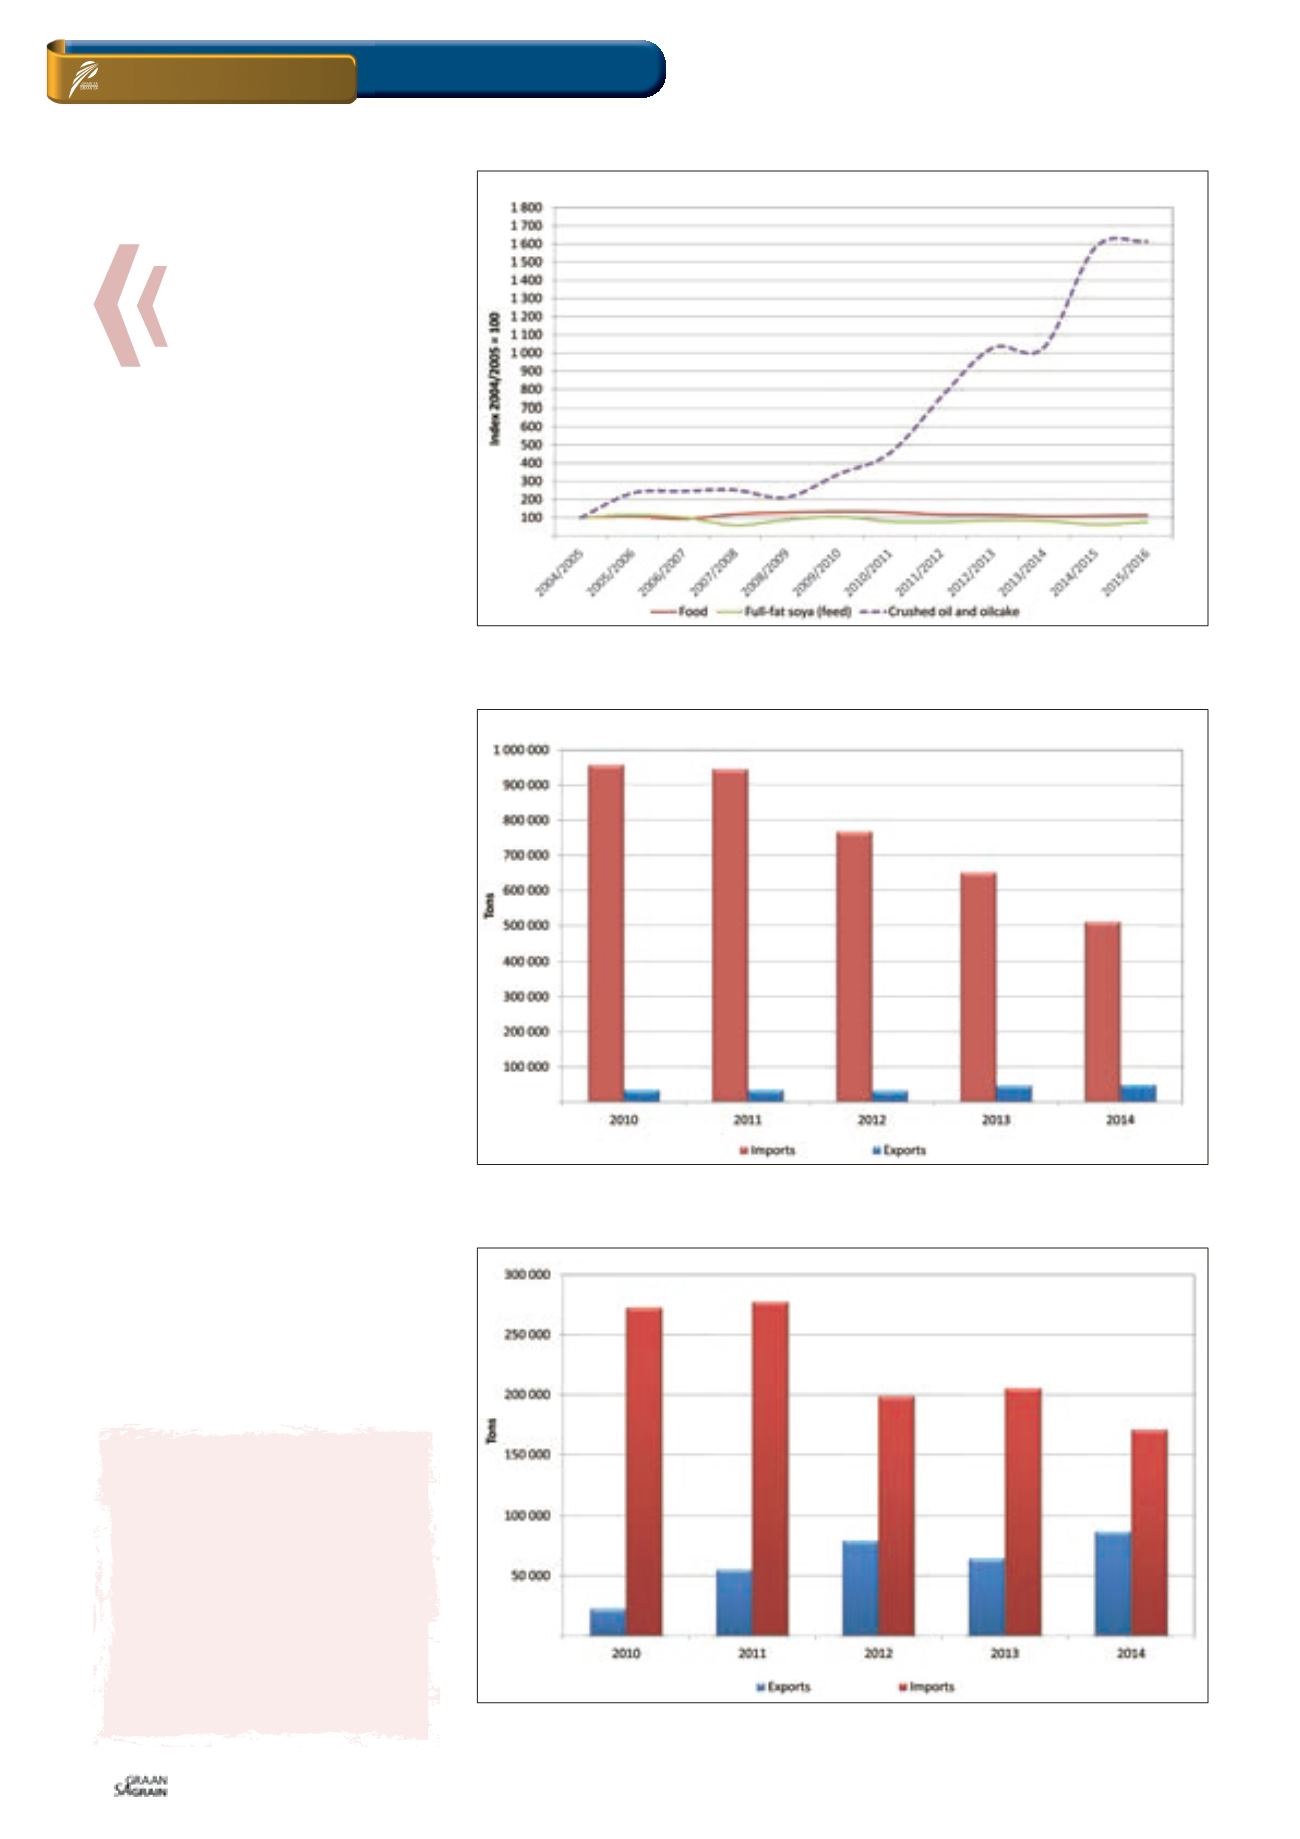
Soybean is mainly consumed in three
forms, namely: Food, full-fat, crushed
oil and oilcake. Crushed oil and oilcake
has shown a significant increase in the
past twelve years – currently estimated
at around 880 000 tons. The full-fat and
food consumption stabilised at around
142 000 tons and 26 000 tons respectively.
These figures signal the increasing demand
from the feed industry.
Graph 3
depicts these increases in a twelve
year consumption index. It is important to
highlight that the crushing plants or soy-
bean processors are not currently function-
ing at full capacity and domestic soybean
production is still well below the estimat-
ed capacity. The country would have to
double its estimated production in order to
reach full capacity.
However, that would affect the price move-
ment and profitability of the crop. For the
current season, Grain SA forecasts soy-
bean imports at 170 000 tons, which is
65% higher than the previous season and
the highest import estimate in the past
twelve years.
Trade perspective
South African soybean imports are estimat-
ed to be at the highest levels in years due
to an increasing demand in the processing
industry. However, imports of soybean oil-
cake have been decreasing.
Graph 4
illustrates South African oilcake
imports for the past five years. From 2010
to 2014, South African oilcake imports have
decreased by 47%. This is positive for the
economy and displays a positive gain from
the investments made in the processing in-
dustry (crushing plants).
From 2012 to 2014 South African oilcake
imports decreased by 33% – falling within
the period when some of the new crush-
ing plants became operational. The import
decreases shows positive results from the
investment made in pursuing the import re-
placement governmental strategy.
Graph 3: South African soybean consumption.
Source: Grain SA (2015)
Graph 4: South African soybean oilcake imports and exports.
Source: Trade Map (2015)
Graph 5: South African soybean oil imports.
Source: Trade Map (2015)
GRAIN MARKET
OVERVIEW
“
South African soybean
production has respond-
ed positively to these
changing demands, and
for the first time ever,
the country’s production
is projected to reach
1 million tons...
“