


 23 / 84

21
April 2016
production credit, interest rate subsidies and assisting producers
in financial distress with a wage cash grant to help them retain
farm workers.
The total fiscal outlay required over a period of three years amounts
to R12 569 793 100. The process will be led by an operational
team/data management unit and be subjected to an audited pro-
cess. The motive behind this work is to be able to put something
concrete on the table when talking to government. It is impera-
tive that aid is given to all producers in South Africa, particularly
since this country produces 61% of all the food supplied into the
southern African region.
Agri SA drought disaster relief fund
Agri SA and Senwes established a Drought Relief Fund in Novem-
ber last year. Funds raised by February 2016 amount to R8,6 mil-
lion. The purpose is to fund the purchase and transport of feed
for livestock, distribute food hampers for destitute farm workers,
funding the distribution of water and sinking of boreholes among
other assistance.
Van Zyl described an overwhelming spirit of goodwill amongst
South Africans for all producers struggling against this debilitating
drought. To date 4 000 producers have been helped, 10 000 bales
and 80 tons of maize meal have been delivered. South Africans are
rallying together in support of the sector. There is a huge apprecia-
tion by the public for what the producers of this country do.
‘The helping hand is at the end of
your arm’
Van Zyl said that we need to help ourselves and realise we are not
separate entities but integrally linked as we address the current
challenge. Leaders like Agri SA will keep on talking to government
and seeking solutions for relief.
He believes the door is opened by a greater awareness of the val-
ue of food production than ever before. He believes we are facing
a turning point in our history; producers must keep the faith and
encourage one another. We are the only people on this continent
who can do what we do!
Currently the chances of La Niña seem to be
increasing but there is no certainty at pre-
sent. Winter needs to begin (earliest May)
before there can be any confidence in pre-
dictions of either a strong El Niño or La Niña
system arising.
Do forecasts work?
Looking at different models and correlation
charts (Spearman’s correlation) between
the observed and the actual measured re-
sults for regions where there is an appear-
ance of these systems, e.g. the results for
the Philippines have proved most accurate
while South Africa’s seasonal prediction
ability is limited.
So what about climate
change?
Models have been drawn up where observ-
ing only natural forcings (influences on cli-
mate) have been compared to models using
both natural and anthropogenic (caused by
human activity) forcings. It is clear that hu-
man activity is certainly contributing to the
dilemma of climate change. We have to ad-
dress this problem by changing our behav-
iour patterns.
Climatologists have great ability to project
temperature scenarios in the future for
seasons ahead. Extreme maximum tem-
peratures can be projected rather reliably.
Future scenario charts show a lot more red
zones in the future.
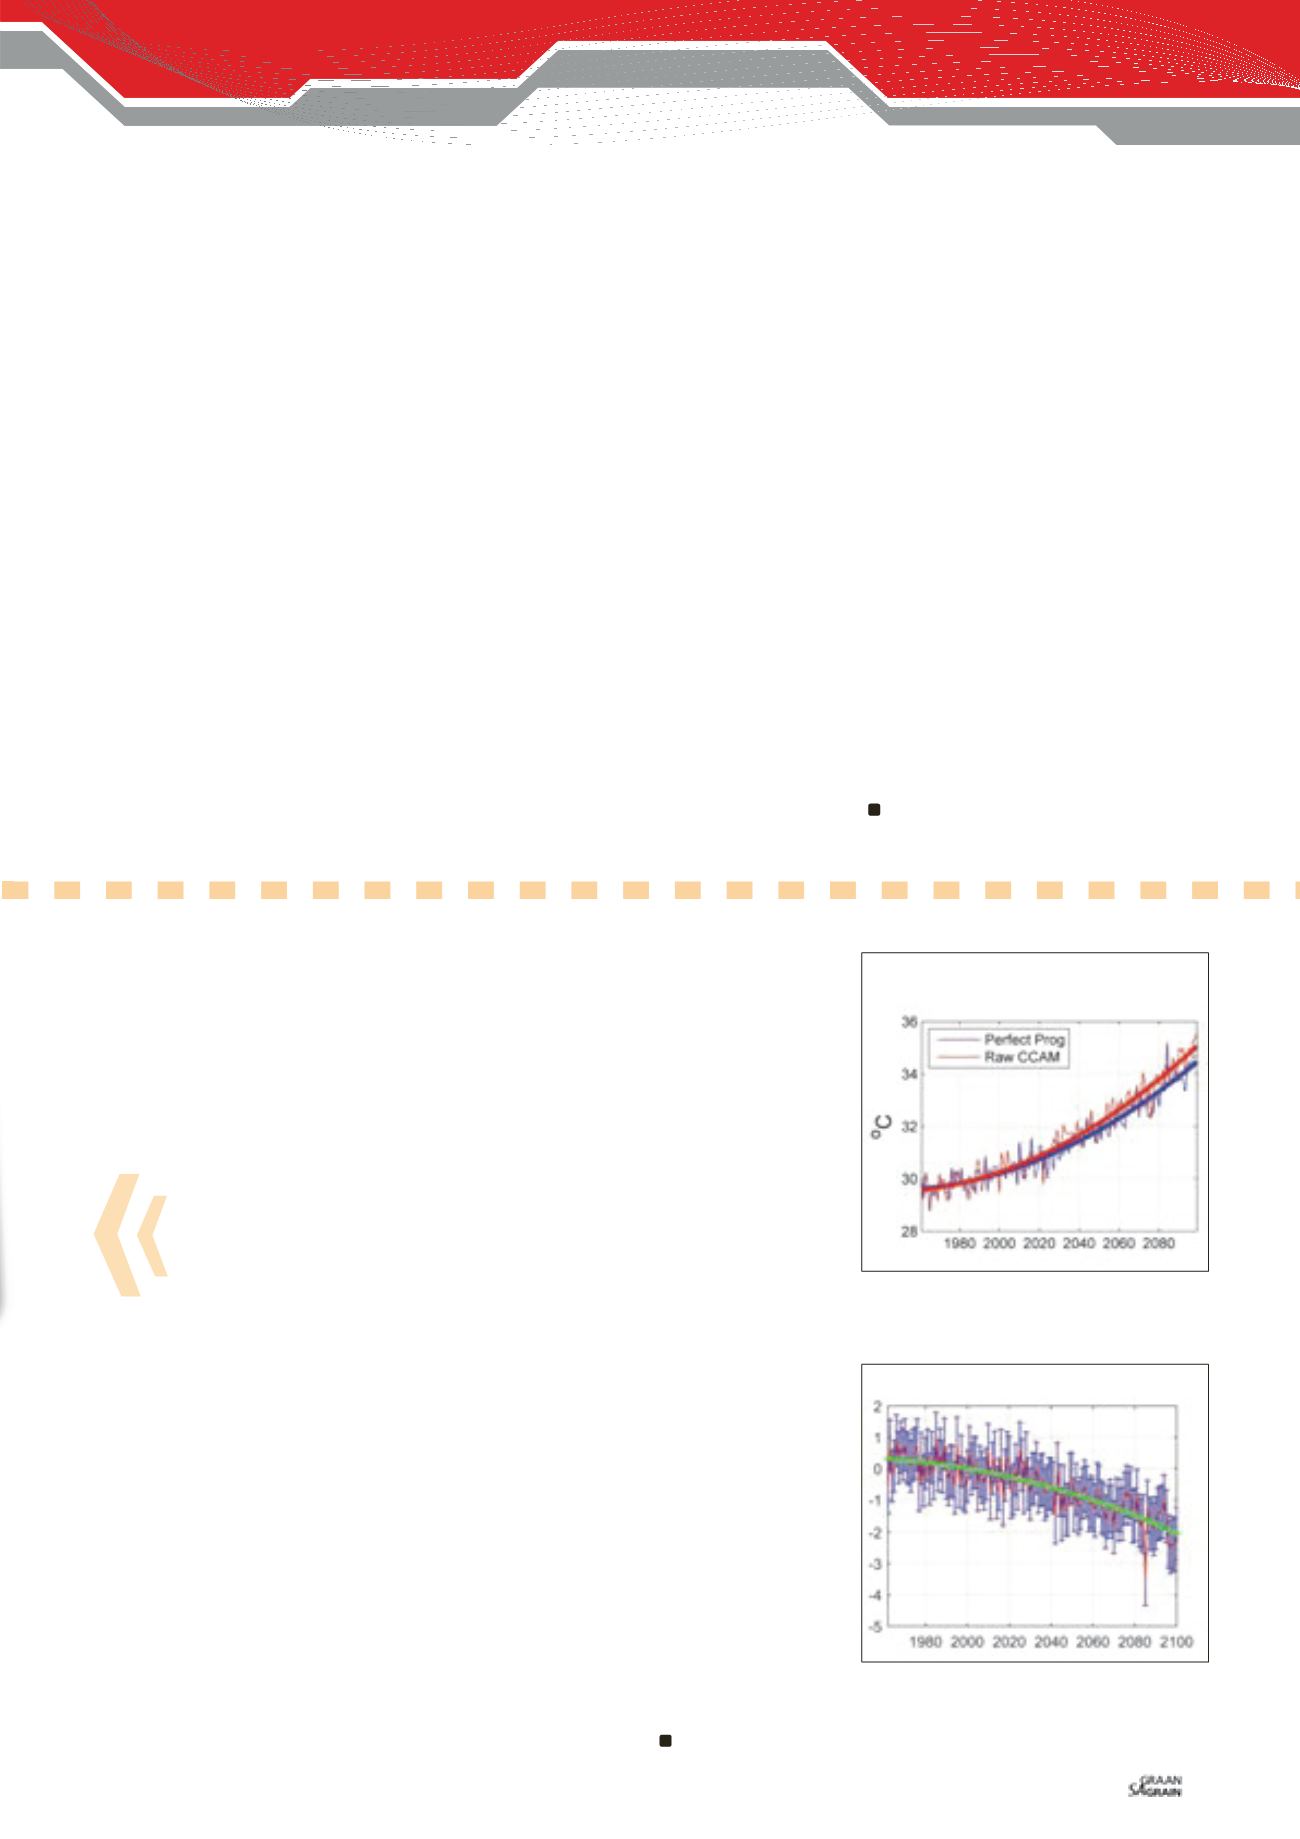
Temperatures are projected to rise sig-
nificantly (
Graph 2
). It appears there will
however not be significant changes in pre-
cipitation levels although the trend will be
towards drier conditions. The consequence
will certainly be shifts in production area
and reduced yields (
Graph 3
).
Finally Landman says there is a greater need
for co-operation between role-players to-
wards the co-production of data which will
contribute to more useful scenario projec-
tions for the future from all stakeholders in
the agricultural sector.
Graph 2: Two models were combined and both
indicate rising temperatures in the next few
decades.
Graph 3: Only projected temperatures and no
rainfall projections were used to draw up the
following projection of maize yields in the
Witbank region for the next few decades.
SADC DJF maximum temperatures:
Ensemble mean and area average
Witbank maize yield index
Facing climate variability and change