


 31 / 48

29
January 2019
(measured by the Producer Support Esti-
mate), consumers (measured by the Con-
sumer Support Estimate) and support
to general services to agricultural sector
(measured by the General Service Support
Estimate). Transfers included in the Pro-
ducer Support Estimate are composed of
market price support, budgetary payments
and the cost of revenue foregone by
the government and other economic agents
(
Figure 1
).
Figure 2
depicts a breakdown of agricultural
support for the USA compared to South Af-
rica over the years. It is clear from the fig-
ure that support in South Africa has always
been minimal compared to the USA and has
decreased significantly over the years.
Producer protection
according to OECD
Producer protection, measured by the Pro-
ducer Nominal Protection Coefficient (NPC)
is defined as the ratio between the average
price received by producers (measured at
the farm gate), including net payments per
unit of current output, and the border price
(measured at the farm gate).
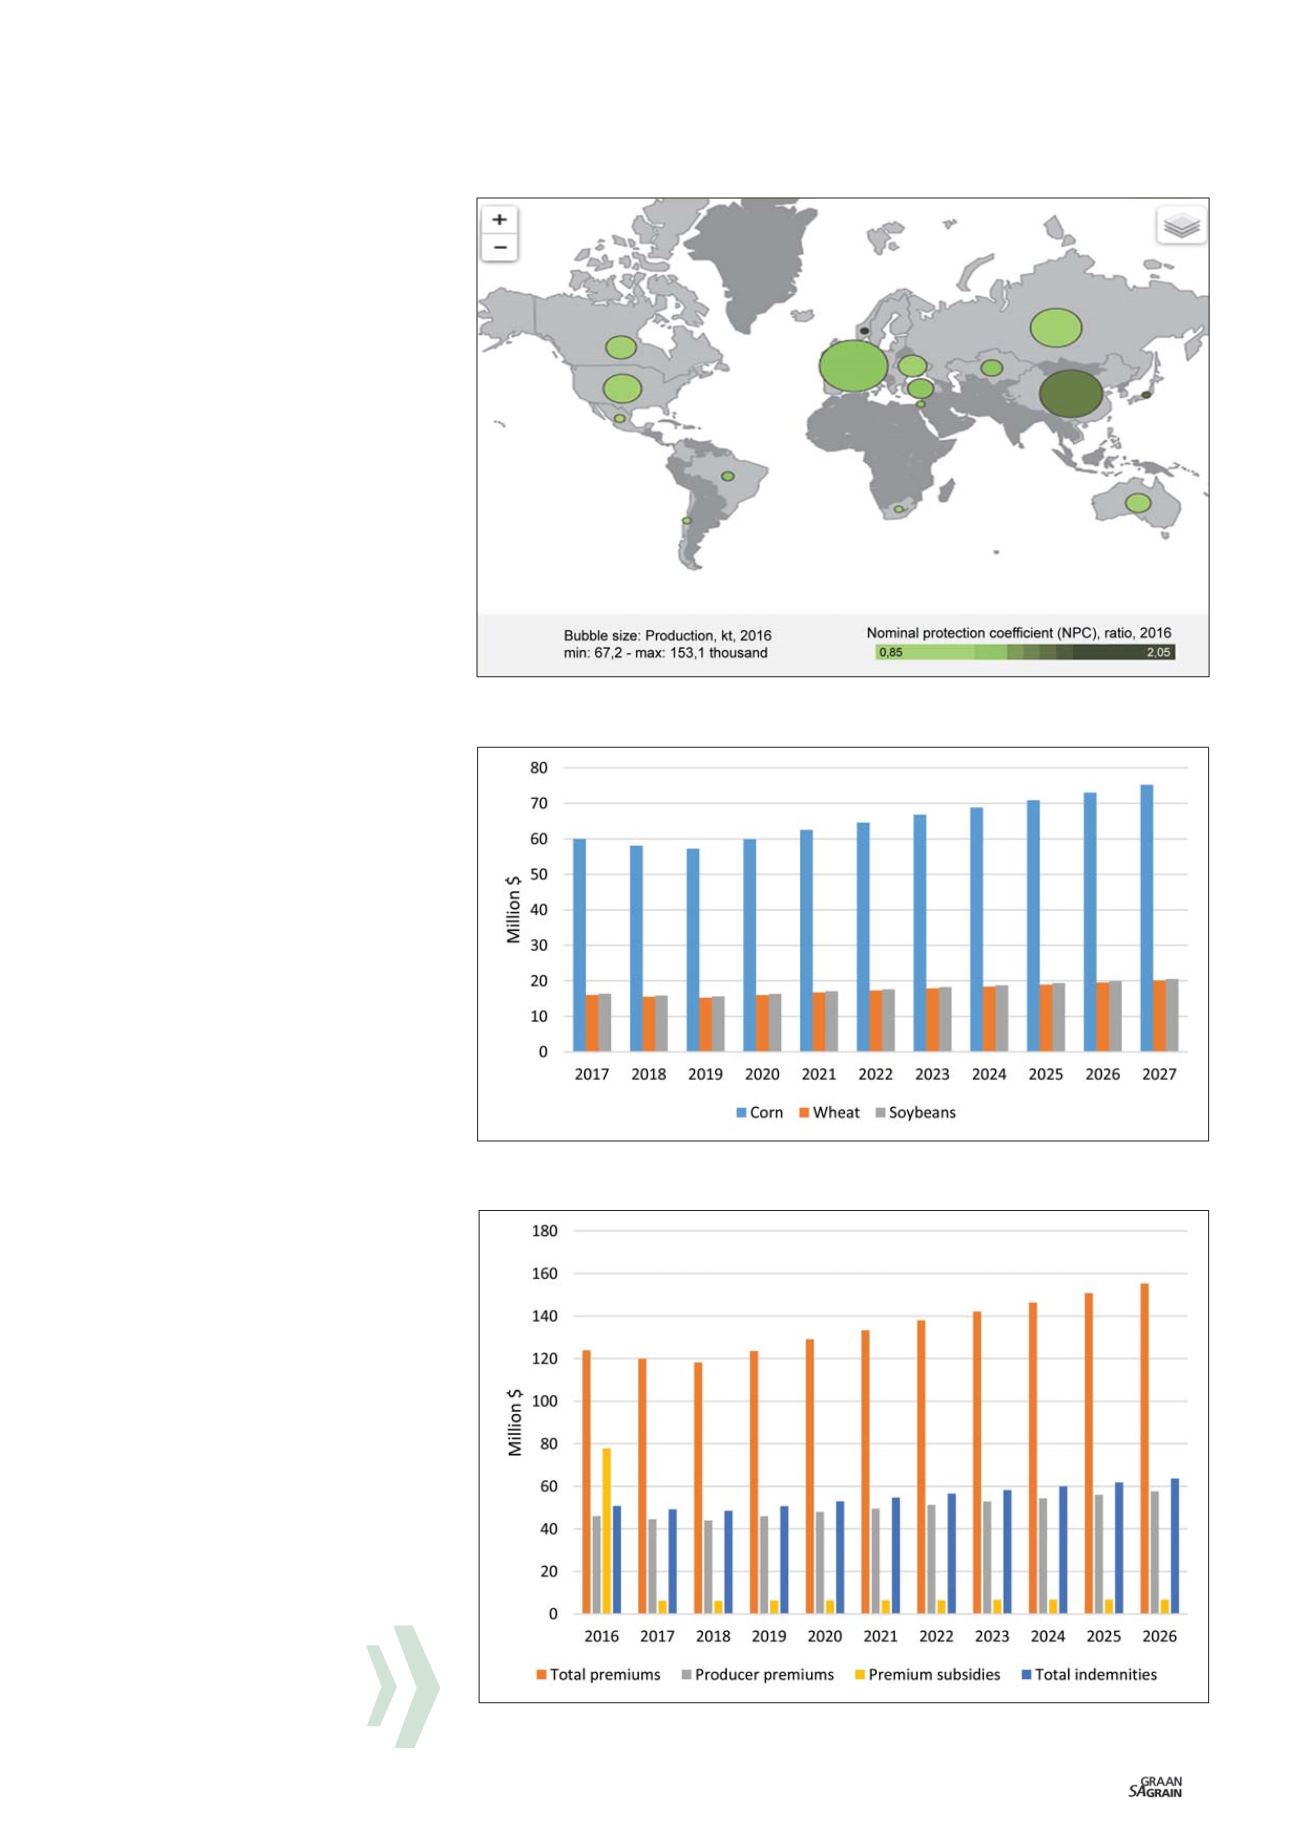
The NPC scale for wheat ranges from 0,85 to
2,05 (
Figure 3)
. For instance, an NPC of 1,10
suggests that producers, overall, received
prices that were 10% above international
market levels. South Africa has an NPC of
1,00 for wheat, meaning it does not receive
any support for the commodity, while the
USA has an NPC of 1,01 for wheat, meaning
that it receives prices that are 1% above the
international market level.
Bubble size represents production in kt (a
unit of count defining the number of kits/
barrels for grain) for the year 2016, with the
minimum being 67,2 thousand and maxi-
mum 153,1 thousand.
How do USA farm
subsidies work
The USA government spends more than
$20 billion a year on subsidies for farm
businesses. About 39% of the 2,1 million
farms receive subsidies, with the biggest
portion going towards maize, soybean,
wheat, cotton and rice. These subsidies are
meant to protect producers against fluc-
tuations in prices, revenues and yield. They
subsidise their conservation efforts, insur-
ance coverage, marketing, export sales, re-
search and other activities; government aid
is deep and comprehensive.
Graph 1
depicts USA government spending
on corn (maize), wheat and soybeans from
2017/2018 and shows an outlook of what will
be spent for the next ten years.
Graph 1: USA net government outlay on corn, wheat and soybeans.
Source: FAPRI, 2017
Graph 2: USA crop insurance programme.
Source: FAPRI, 2017
Figure 3: NPC for wheat.
Source: OECD, 2016