


 29 / 116

27
October 2018
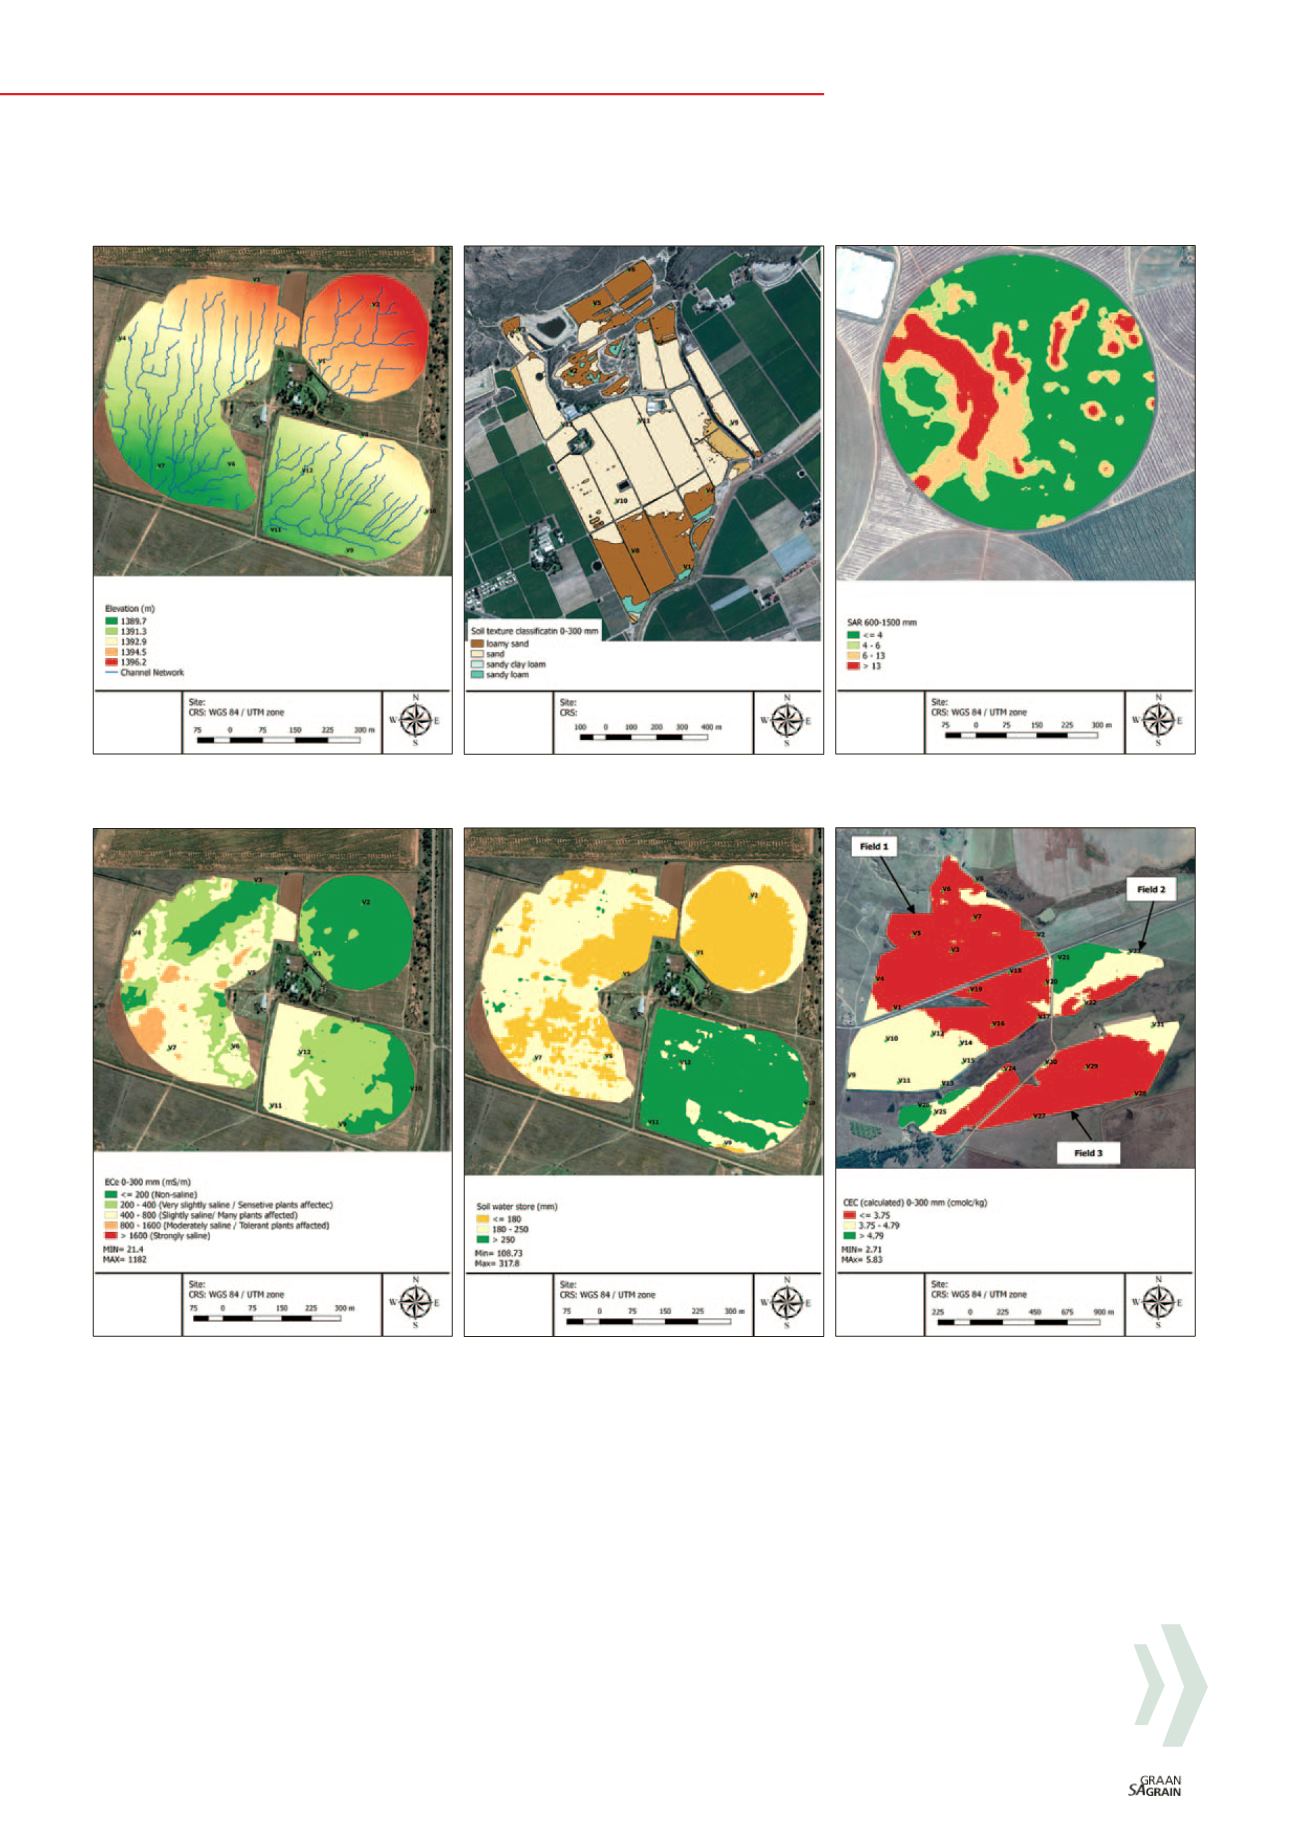
Figure 1: Topography – drainage.
Figure 4: Salinity management.
Figure 2: Soil classification.
Figure 5: Soil water storage.
Figure 3: Waterlogging.
Figure 6: Fertility management.
ECa data application
Soil sampling is the most important phase
in a soil survey and the methods used when
sampling soils can have a large influence on
the outcome of spatial variability studies.
With a geo-statistical model-based sam
pling method, ECa survey data is used to
identify optimal locations for soil sampling.
The identified sampling sites represent
±95% of the variation in the ECa data.
Soil samples are needed to
in situ
calibrate
laboratory measured soil properties to ECa
data to establish a prediction model. The
model can be used to predict and map soil
properties for the remaining ECa measure
ments in the surveyed field.
This process of automatically selecting
sampling sites saves the researcher time
and effort. The amount of samples needed
for calibration can be much less than that
needed during systematic grid sampling.
Thus, the workload and cost in the field and
laboratory are much less than for the tradi
tional methods.
In a Van’s Lab soil survey, the EM38 is set
to measure ECa at a fixed rate of one meas
urement per second. The survey density
depends on the crop, transect spacing and
the hectares (
Table 1
on page 28).
Identified soil sampling points are also used
for physical investigation and soil classifica
tion. Disturbed soil samples (
Photo 3a
on
page 28) are taken for soil fertility, salinity
and sodicity and textural analysis.
Undisturbed soil cores (
Photo 3b
on page 28)
are important for the measurement of physi
cal soil properties such as bulk density, satu
rated hydraulic conductivity, and soil water
management borders, namely the saturation
point, drained upper limit and lower limit of
plant available water.