


 27 / 84

Product information
25
April 2018
Planting less
Other structural solutions would be either
planting less or increasing demand in the
country.
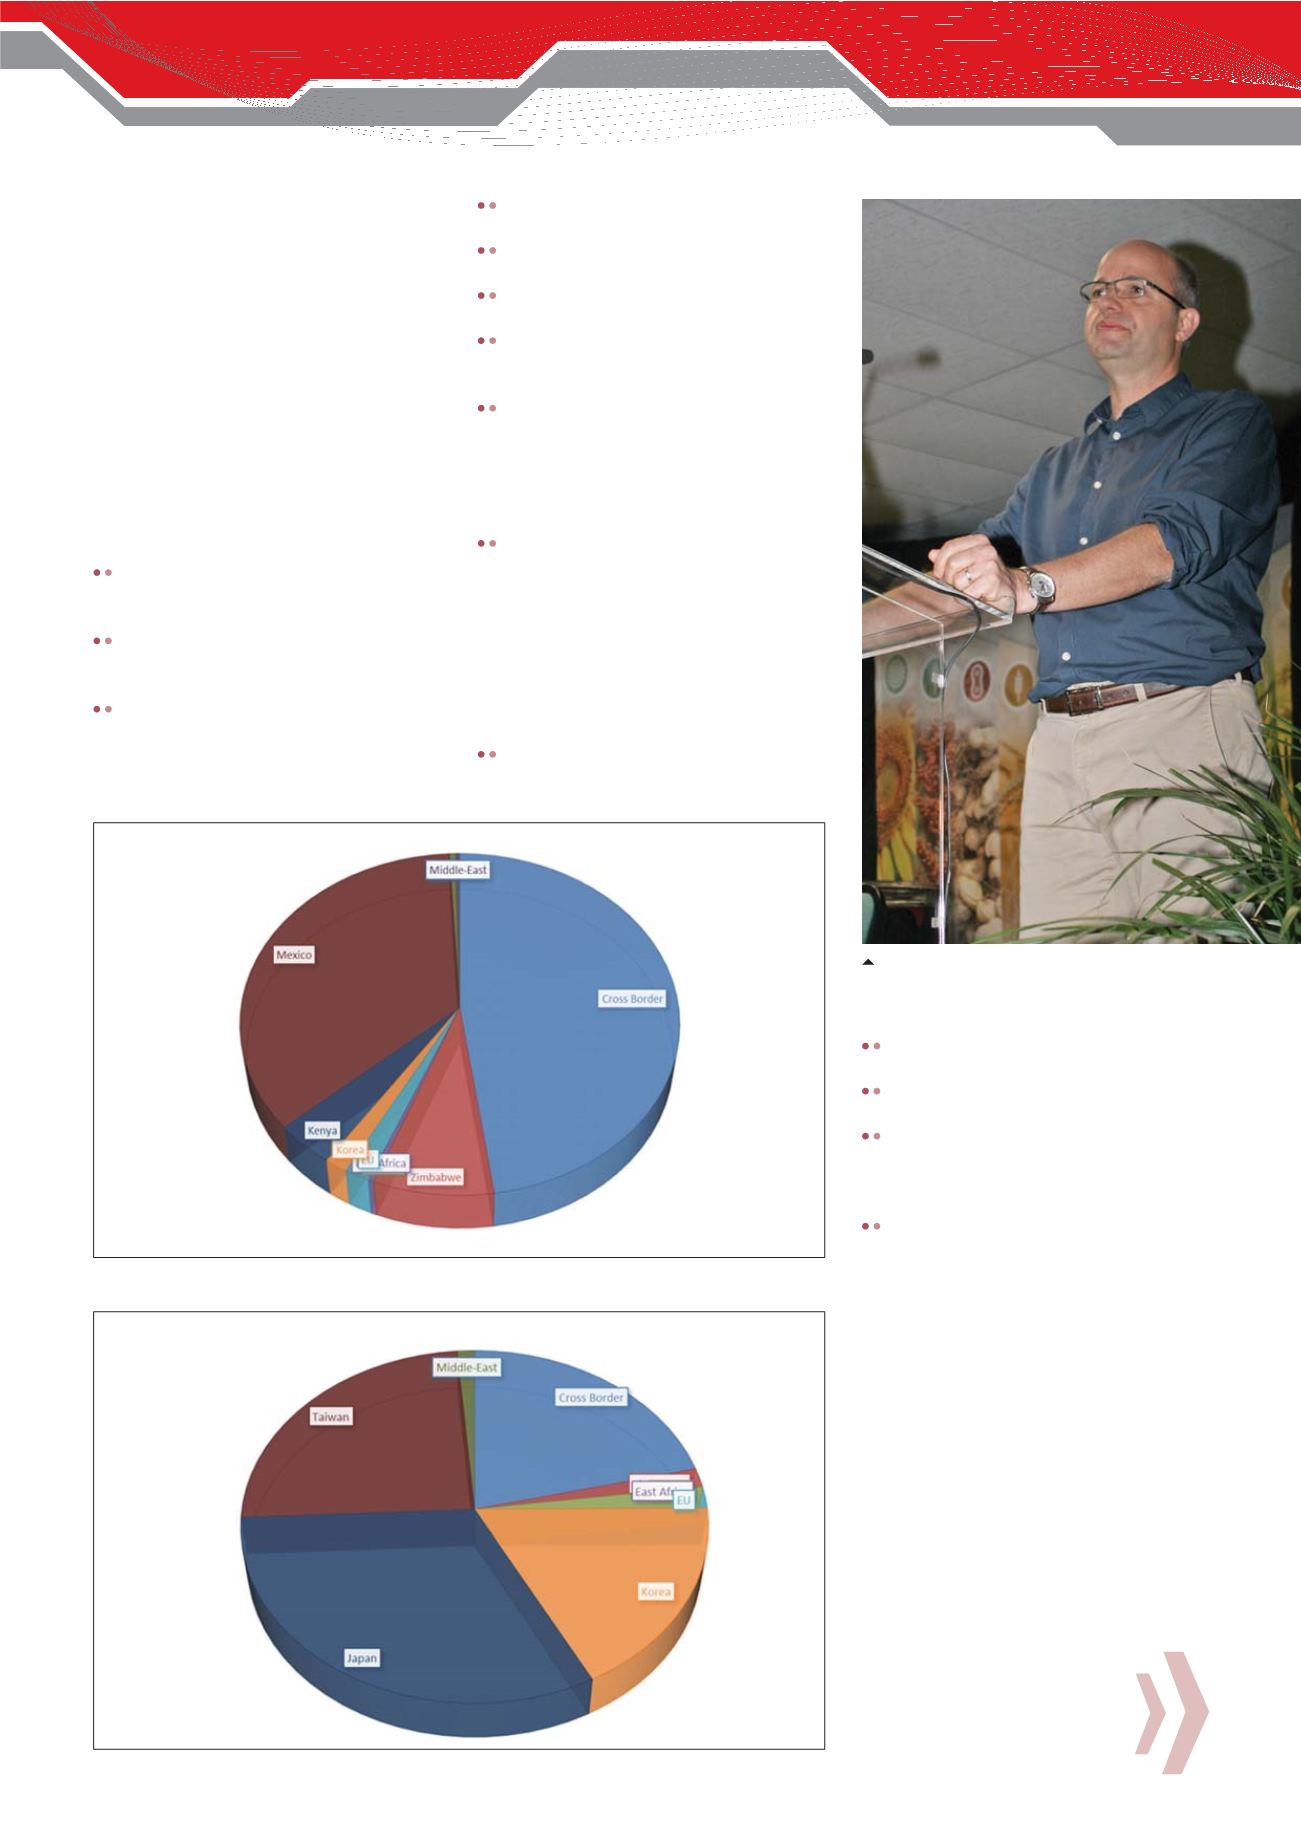
Export destinations
Our exports have traditionally flowed re-
gionally, cross-border but exports are
moving sideways at present (
Graph 3
and
Graph 4
). Recent exports to Mexico could
be a once-off as the USA usually supplies
them. In most instances we are competing
with the USA, so South African producers
are always on the back foot.
Other influences
Freight spreads – cost of freight influ-
ences our ability to compete with the
competition.
China has a surplus of maize and partici-
pates in the market as an exporter not
an importer.
Protocols, biosafety and phyto-sanitary
regulations: Without agreements in
place no exports are possible. These
take time and require expertise.
Malaysia doesn’t like USA maize but
we still must compete with Brazil.
Iran is a good option but we’re still work-
ing on bio-safety protocols.
Vietnam is open to South African grains
and COFCO will ship there soon.
EU is not a logical destination in terms of
freight economics but we are shipping
there at present.
Venezuela imports 1 million tons/year
grains and is an attractive white maize
destination for our product. They pay
R300/ton premium and Jetten says
South Africa is close to agreement with
them.
The world is not waiting for South Afri-
can soybean exports. The product is not
well known and variation in quality is a
challenge.
Differentiation and cost
leadership
There is no great opportunity for differentia-
tion on any grain commodity:
Our maize product is considered best
in the world: Low moisture, low foreign
matter, minimal breaks but struggling to
get a premium.
Soybeans have variable quality and low
oil content.
Cost of moving grain in South Africa is
expensive.
Rail versus road: There is improved
movement by rail but there are limita-
tions to numbers of rail trucks on export
corridor (32 per day).
Terminals: Port logistics are not as ef-
ficient e.g. Argentina loads one vessel
per day, Durban loads the same vessel
in five days – this costs us.
Value-adding
Crush capacity
Increased crush capacity has absorbed in-
creased production – but not everything.
This limitation is based on the absorption of
local meal in the feed industry.
Vertically integrated
value chain
There are substantial volumes of frozen chick-
en imports. This needs to be stopped and
translated into local poultry production which
consumes locally produced grain. This would
make a significant impact and will assist both
maize and soybeans in local markets.
Ethanol from maize
Support for the ethanol industry is a logi-
cal choice.
Graph 4: South African yellow maize exports from 2011 to 2017.
Ronald Jetten
Graph 3: South African maize exports from 2011 to 2017.