


 54 / 73

THE
GRAIN AND OILSEED INDUSTRY
OF SOUTH AFRICA – A JOURNEY THROUGH TIME
ႇႆ
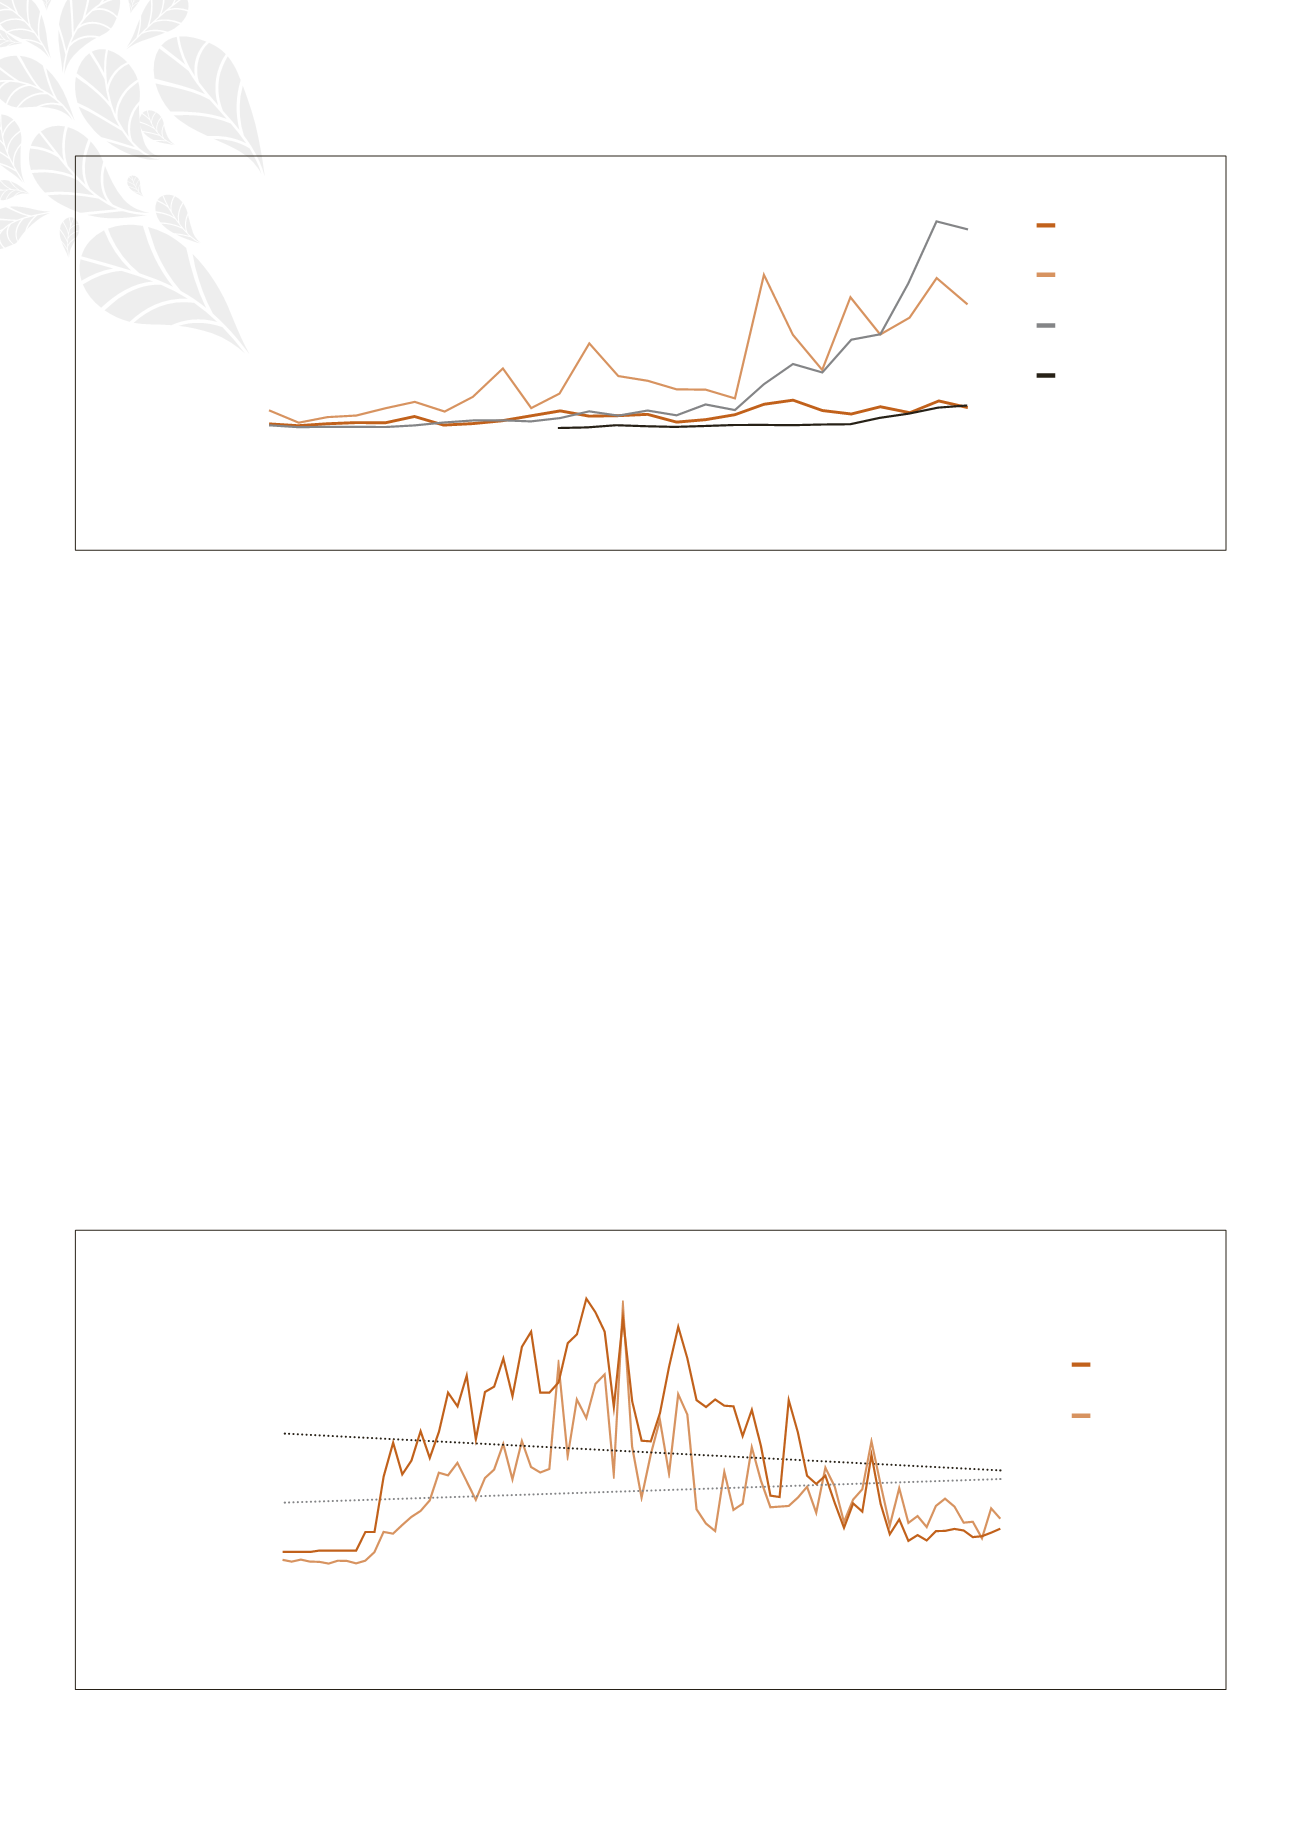
However, in the period from 1997 up to approximately 2009 the average yield/
hectare showed a rising trend. Upon closer examination it seems this can probably
be attributed to the fact that the cultivation of groundnuts on dryland decreased,
while there was an increase in the use of irrigation.
Groundnuts are very sensitive to unfavourable climatic conditions, which explains
why there is not a big correlation between the total area on which groundnuts are
planted and the total yield produced – as the graph above indicates.
Harvesting process
Traditionally the harvesting process of groundnuts used a lot of manual labour.
The groundnut plants were pulled from the soil by hand and piled up until the
correct moisture content was reached, after which the pods were harvested and
put into sacks. This meant that the harvest was delivered to buyers in sacks.
Therefore, groundnut production was a very labour-intensive process. It was believed
that the decrease in production since approximately 2002 could largely be attributed
to labour problems on the back of labour legislation applicable in South Africa after
1994, as well as the increasing labour costs that made it more viable for producers to
plant other crops that were not so sensitive to unfavourable climatic conditions.
During the late 1990s the idea developed that the production of groundnuts will
only be expanded on a larger scale in South Africa if the process could be mecha-
nised to a greater extent. Calculations done in 1999 indicated that it was cheaper
450 000
400 000
350 000
300 000
250 000
200 000
150 000
100 000
50 000
0
1936/1937
1939/1940
1942/1943
1945/1946
1948/1949
1951/1952
1954/1955
1957/1958
1960/1961
1963/1964
1966/1967
1969/1970
1972/1973
1975/1976
1978/1979
1981/1982
1984/1985
1987/1988
1990/1991
1993/1994
1996/1997
1999/2000
2002/2003
2005/2006
2008/2009
2011/2012
2014/2015
Graph 22: Production statistics of groundnuts 1936/1937 to 2014/2015 – hectares and tons produced
Tons
Hectares
Graph 21: Value of oilseed production since 1990
6 000 000
5 000 000
4 000 000
3 000 000
2 000 000
1 000 000
0
R’000
1990/1991
1991/1992
1992/1993
1993/1994
1994/1995
1995/1996
1996/1997
1997/1998
1998/1999
1999/2000
2000/2001
2001/2002
2002/2003
2003/2004
2004/2005
2005/2006
2006/2007
2007/2008
2008/2009
2009/2010
2010/2011
2011/2012
2012/2013
2013/2014
2014/2015
Sunflower seed
Groundnuts
Soybeans
Canola