


 49 / 73

ႆႋ
CHAPTER 1
crop, with Mpumalanga the second biggest producer (26%), followed by Limpopo
(10%), North West (7%) and Gauteng (2%).
In the period from 2000/2001 until 2014/2015 the total South African sorghum crop
varied between 96 000 tons (in 2005/2006) and 373 000 tons (in 2003/2004), with
an average of 203 360 tons/year.
Graph 18 depicts the yield/hectare of sorghum planted from 1990/1991 until
2015/2016.
Although South Africa is a net exporter of sorghum, trade in this commodity with
other African countries remained relatively low compared to other grains, probably
because some of the other African countries produce even more sorghum than
South Africa. However, exports in 2004 and 2005 were mainly to African countries,
particularly Botswana. Because of quality requirements in Botswana it is vital for the
product to comply with certain minimum standards.
Marketing and prices
From the 1944/1945 to the 1948/1949 season sorghum marketing was handled
by the Maize Board, but from 1949 to 1957 there was no formal control over this
marketing. From the 1957/1958 season onwards sorghum was again marketed by
the Maize Board as part of the Summer Grain Scheme until the Sorghum Board
was established on 31 January 1986. This board then took control of sorghum
marketing until the Marketing of Agricultural Products Act of 1996 came into
effect on 1 January 1997. After that sorghum, like the other grains in South Africa,
was traded without restriction on the free market.
Sorghum prices fluctuate considerably. When local sorghum production exceeds
the domestic consumption needs for food and beverages, the sorghum price is de-
termined by the lowest price of competing grain (yellow maize). In years in which
the domestic demand for sorghum is greater than the local production, the price
depends on the import parity and the premium paid for malt quality.
During 2005 and at the beginning of 2006 sorghum producers experienced enor-
mous cost-price pressure. Producer prices of sorghum dropped drastically, main-
ly because of overproduction and a stronger currency rate, while input costs of
imported inputs like fuel, chemicals and fertiliser increased rapidly. This raised
doubts about the prospects of cultivating sorghum sustainably and profitably in
South Africa and led to producers being forced to scale down plantings.
Levies
Statutory levies on sorghum that are collected in terms of the Marketing of Agricul-
tural Products Act of 1996 are revised from time to time and the income from these
is employed for research purposes by the Sorghum Trust.
The current levies on sorghum apply until 28 February 2018.
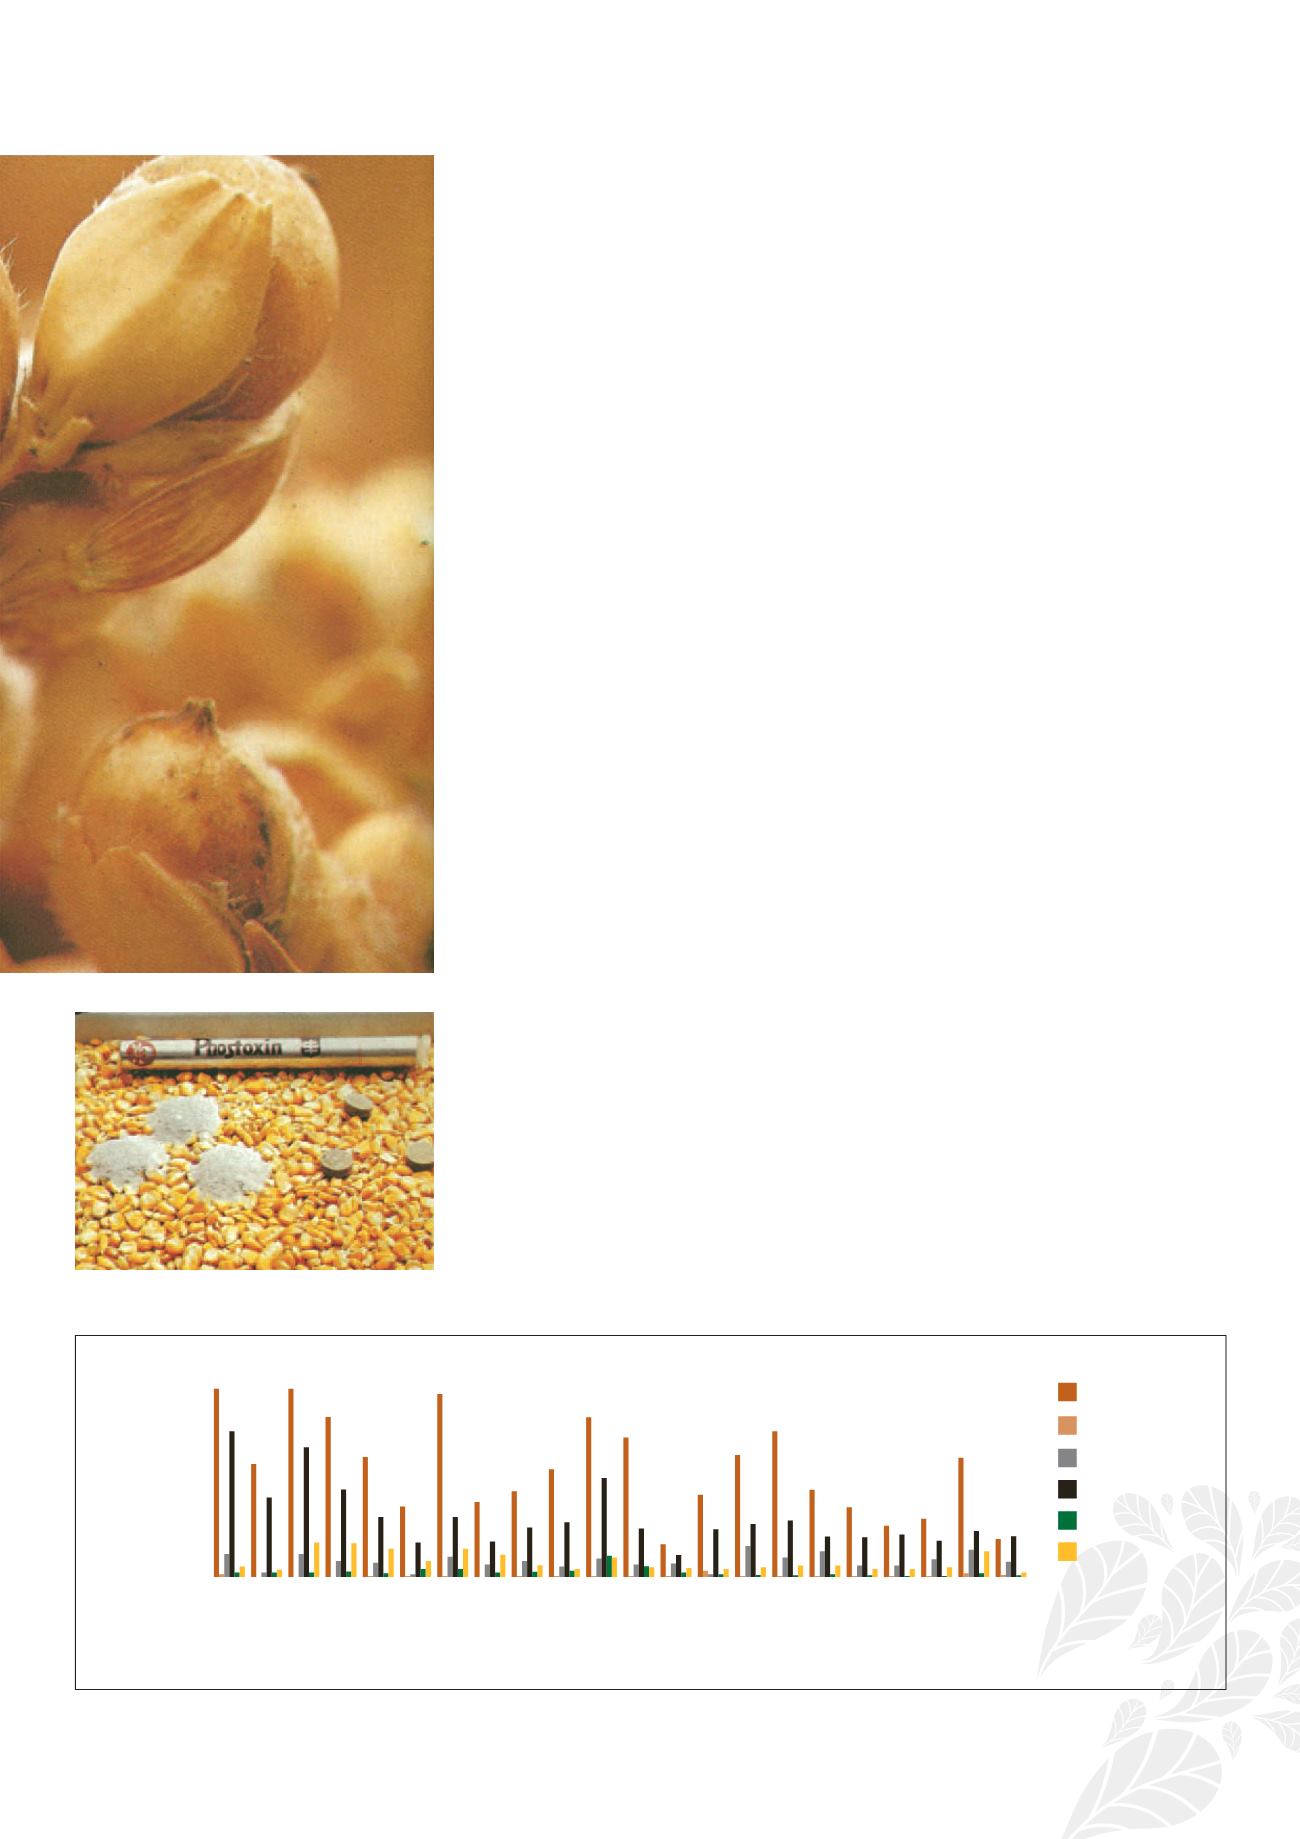
The fumigation of grain against insects.
250,0
200,0
150,0
100,0
50,0
0,0
Tons (thousand)
1993/1994
1994/1995
1995/1996
1996/1997
1997/1998
1998/1999
1999/2000
2000/2001
2001/2002
2002/2003
2003/2004
2004/2005
2005/2006
2006/2007
2007/2008
2008/2009
2009/2010
2010/2011
2011/2012
2012/2013
2013/2014
2014/2015
Free State
Limpopo
Gauteng
KwaZulu-Natal
Mpumalanga
North West
Graph 17: Sorghum production per province