


 58 / 73

THE
GRAIN AND OILSEED INDUSTRY
OF SOUTH AFRICA – A JOURNEY THROUGH TIME
ႇႊ
opportunity for the profitable export of sunflower seeds, after which 100 000 tons
were exported. This was the first export of sunflower seeds by South Africa in
more than a decade.
South Africa is a net importer of sunflower oil, which in theory provides the op-
portunity for the expansion or local sunflower production. However, the fact is that
oilcake obtained from sunflower seeds is not of the same high quality as that of, for
example, example soybeans. Because of its limited use in animal feed formulas as
a result of the high fibre content, the market for sunflower oilcake is also limited.
These facts limit the motivation to expand the production of sunflower.
Marketing and prices
During the regulated period the Oilseeds Board controlled most of the aspects of
the oilseeds industry and therefore also controlled sunflower in a single-channel
system. Producer prices of sunflower seeds were determined by local supply and
demand, as well as the prices of the export pools of the Oilseeds Board, and did
not fluctuate during the season. However, this situation changed drastically in the
last years before the commencement of the Marketing of Agricultural Products
Act in 1997 and the accompanying abolition of the control boards.
At a NOPO Congress held on 10 March 1994 it was decided to recommend to the
Minister of Agriculture, Dr Kraai van Niekerk, that the single-channel pooled sys-
tem for sunflower seeds as well as soybeans had to be retained, but that it had to
be reviewed annually. It was also recommended that producers should be allowed
to deliver sunflower seeds and soybeans directly to registered processors during
the 1994/1995 season. These recommendations were accepted by the minister and
on 22 April 1994 the Oilseeds Scheme was amended accordingly.
10 000
8 000
6 000
4 000
2 000
0
Rands
1990/1991
1991/1992
1992/1993
1993/1994
1994/1995
1995/1996
1996/1997
1997/1998
1998/1999
1999/2000
2000/2001
2001/2002
2002/2003
2003/2004
2004/2005
2005/2006
2006/2007
2007/2008
2008/2009
2009/2010
2010/2011
2011/2012
2012/2013
2013/2014
2014/2015
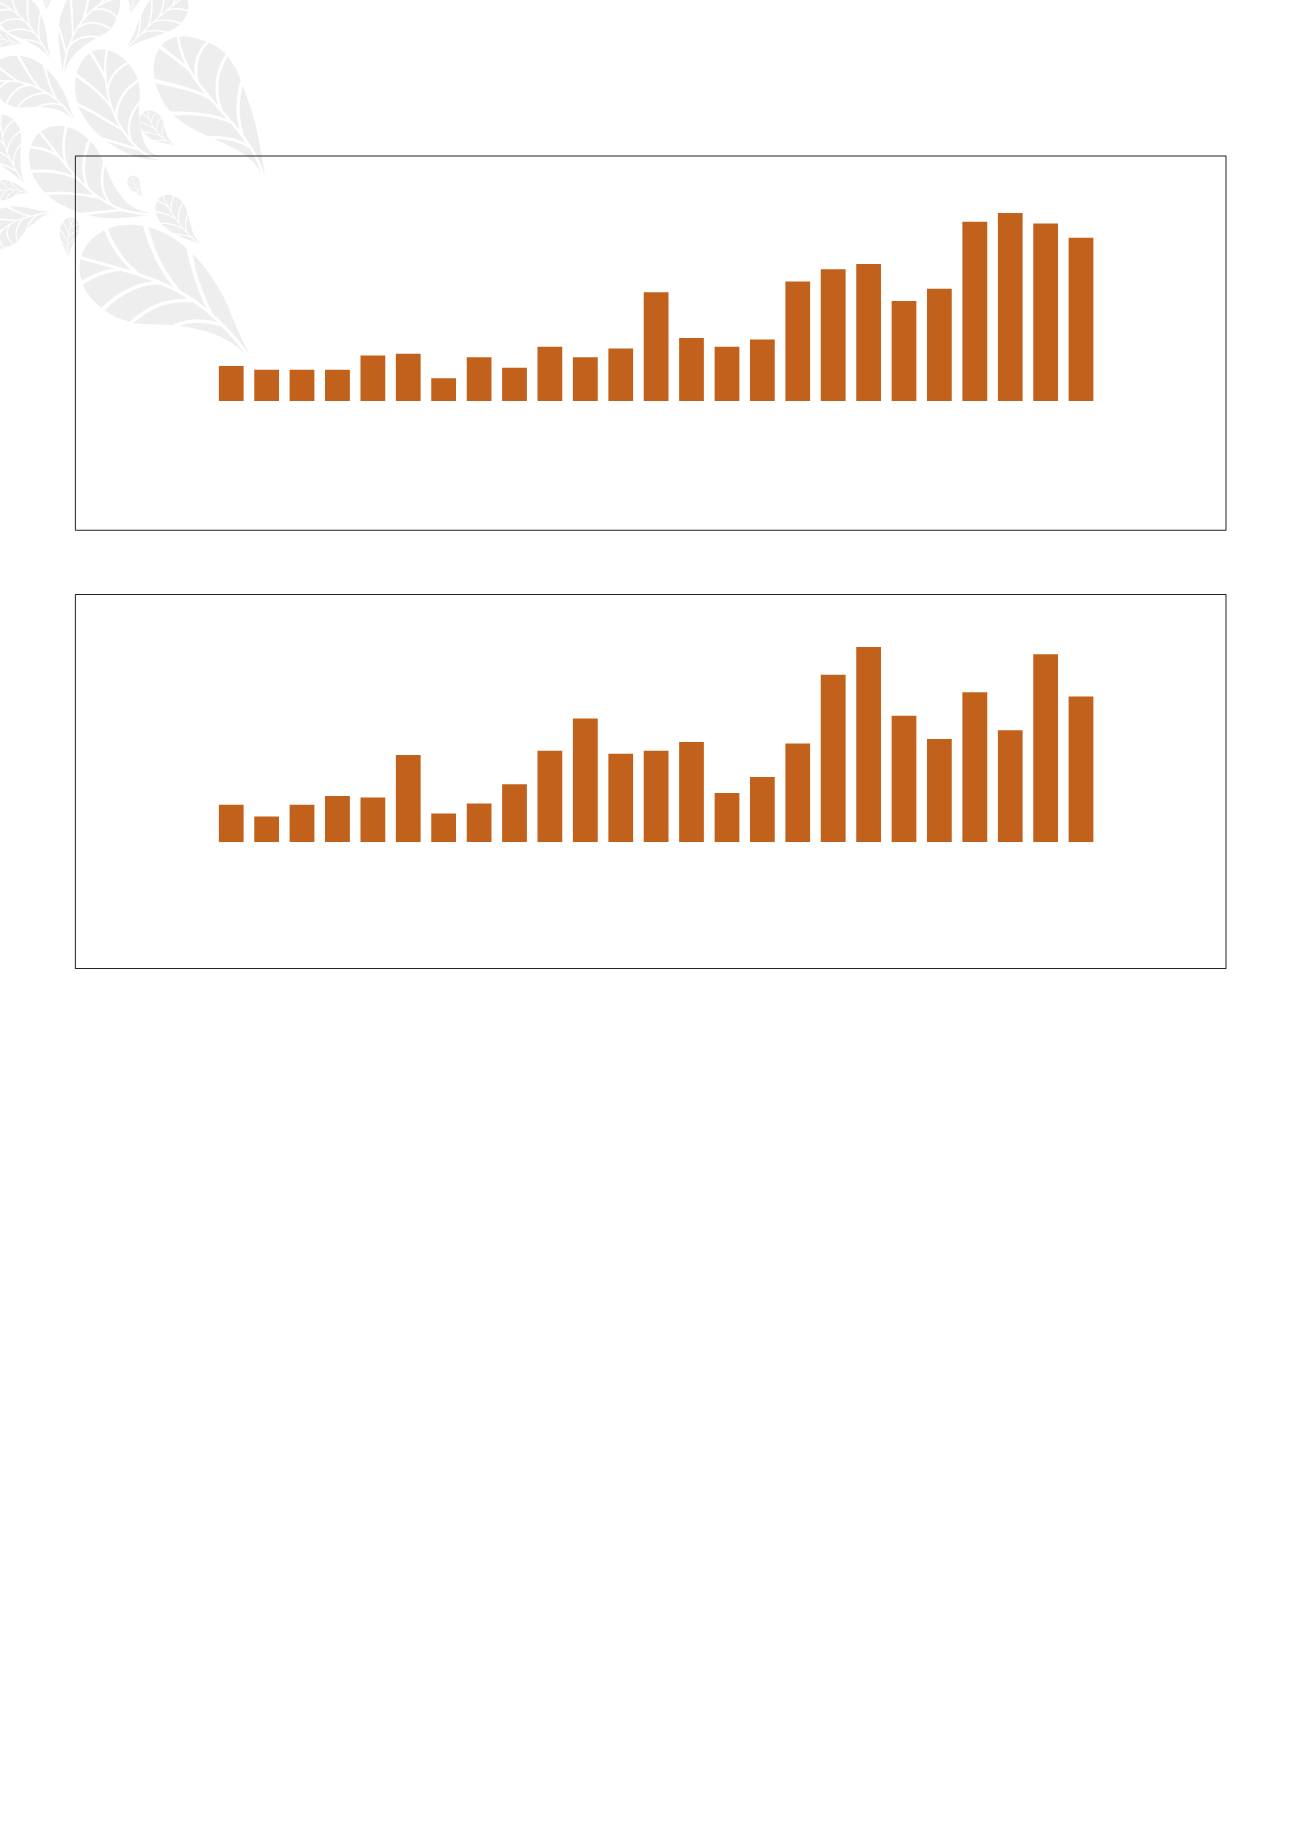
Graph 24: Comparing producers’ prices with total yield per annum from 1990/1991 to 2014/2015
800 000
700 000
600 000
500 000
400 000
300 000
200 000
100 000
0
R’000
1990/1991
1991/1992
1992/1993
1993/1994
1994/1995
1995/1996
1996/1997
1997/1998
1998/1999
1999/2000
2000/2001
2001/2002
2002/2003
2003/2004
2004/2005
2005/2006
2006/2007
2007/2008
2008/2009
2009/2010
2010/2011
2011/2012
2012/2013
2013/2014
2014/2015
Graph 25: Groundnuts – gross yield