


 60 / 73

THE
GRAIN AND OILSEED INDUSTRY
OF SOUTH AFRICA – A JOURNEY THROUGH TIME
DIE
GRAAN- EN OLIESADEBEDRYF
VAN SUID-AFRIK – ‘N EIS DEUR TYD
1 200 000
1 000 000
800 000
600 000
400 000
200 000
0
1950/1951
1952/1953
1954/1955
1956/1957
1958/1959
1960/1961
1962/1963
1964/1965
1966/1967
1968/1969
1970/1971
1972/1973
1974/1975
1976/1977
1978/1979
1980/1981
1982/1983
1984/1985
1986/1987
1988/1989
1990/1991
1992/1993
1994/1995
1996/1997
1998/1999
2000/2001
2002/2003
2004/2005
2006/2007
2008/2009
2010/2011
2012/2013
2014/2015
Hectares
Tons
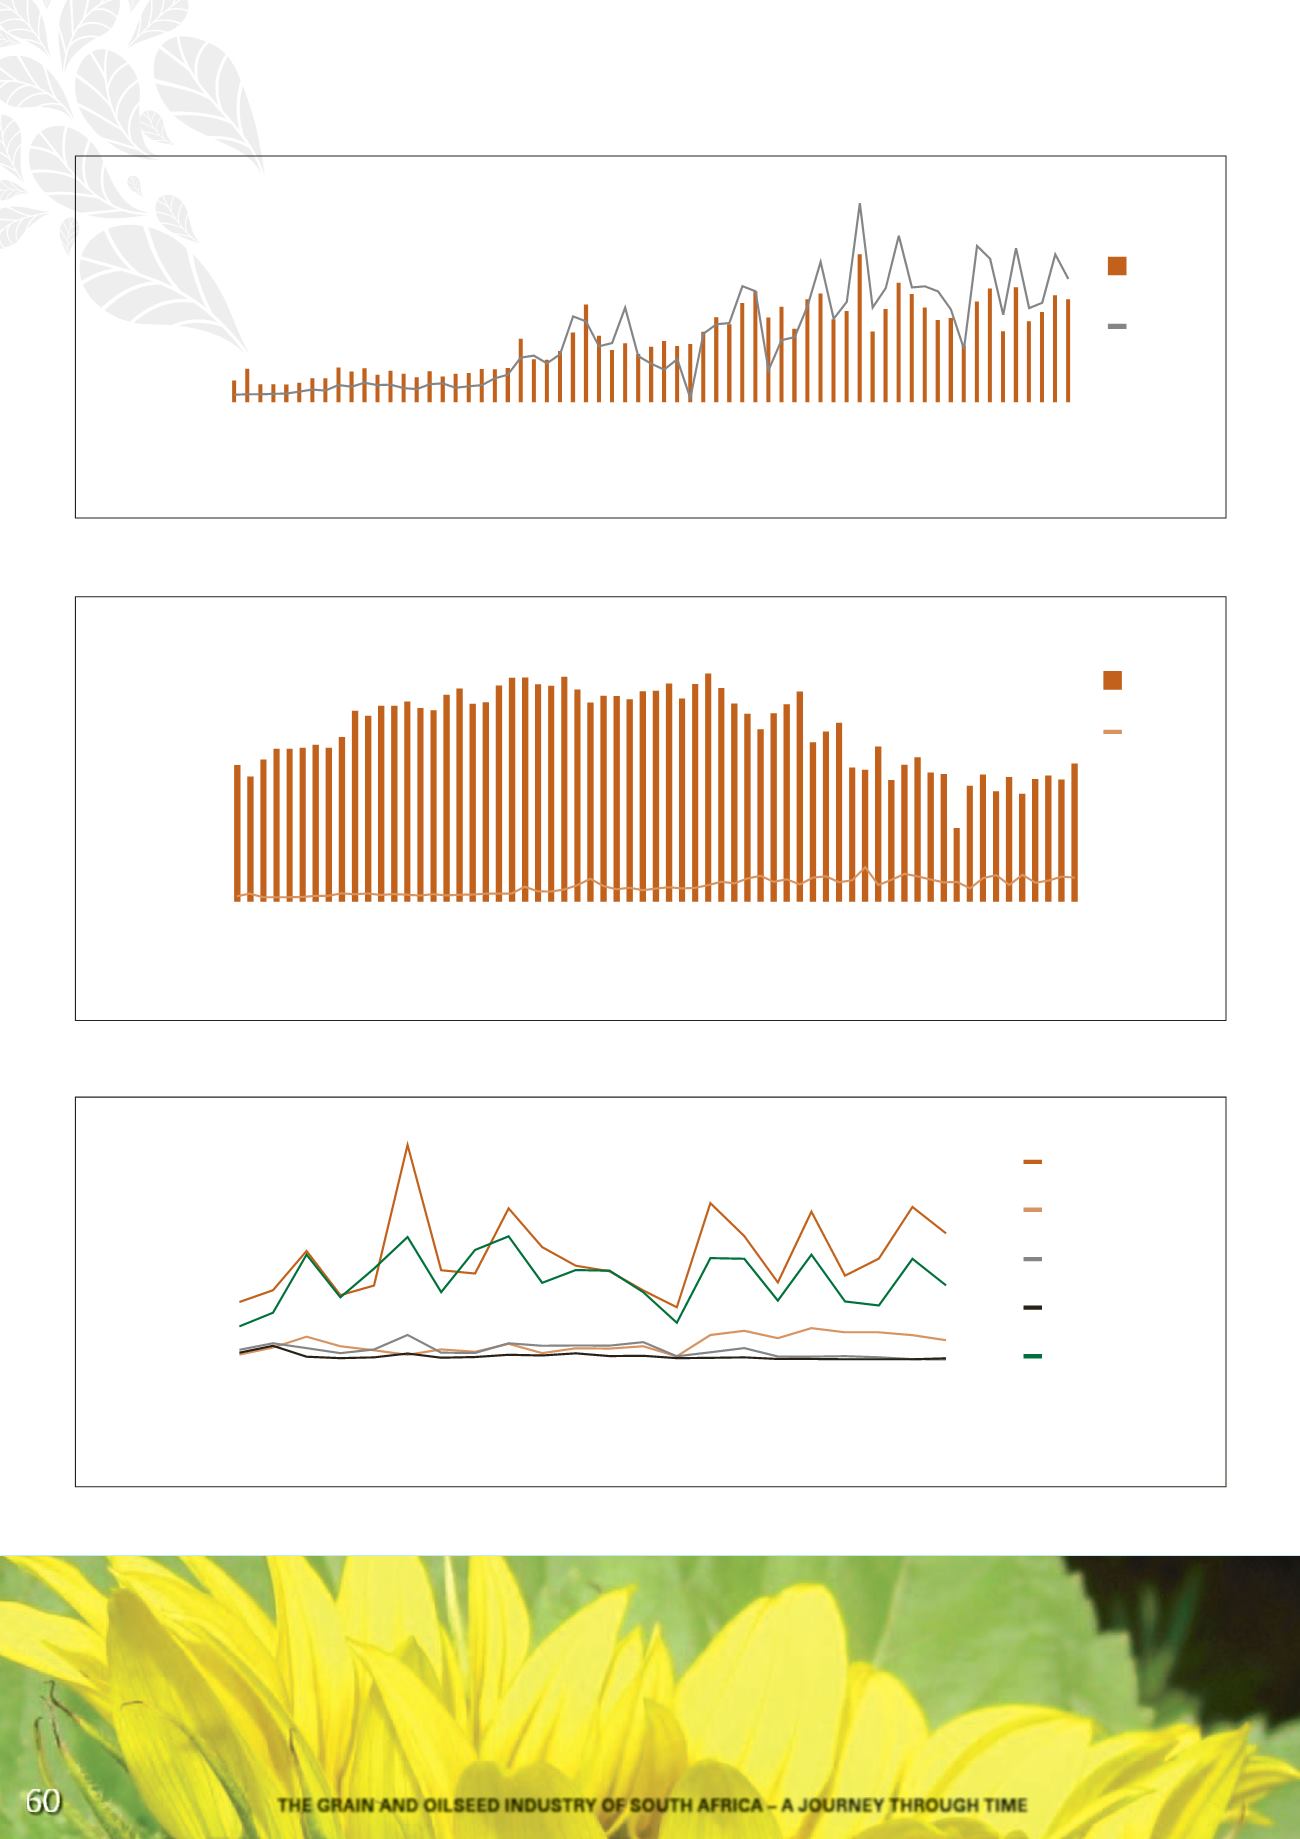
Graph 26: Sunflower production from 1950/1951 to 2014/2015 – the effect of the 1992 drought that also harmed sunflower production
6 000 000
5 000 000
4 000 000
3 000 000
2 000 000
1 000 000
0
1950/1951
1952/1953
1954/1955
1956/1957
1958/1959
1960/1961
1962/1963
1964/1965
1966/1967
1968/1969
1970/1971
1972/1973
1974/1975
1976/1977
1978/1979
1980/1981
1982/1983
1984/1985
1986/1987
1988/1989
1990/1991
1992/1993
1994/1995
1996/1997
1998/1999
2000/2001
2002/2003
2004/2005
2006/2007
2008/2009
2010/2011
2012/2013
2014/2015
Graph 27: Maize production versus sunflower production – hectares per annum since 1950/1951
Sunflower
seed
Maize
Hectares
700
600
500
400
300
200
100
0
Tons (thousand)
1993/1994
1994/1995
1995/1996
1996/1997
1997/1998
1998/1999
1999/2000
2000/2001
2001/2002
2002/2003
2003/2004
2004/2005
2005/2006
2006/2007
2007/2008
2008/2009
2009/2010
2010/2011
2011/2012
2012/2013
2013/2014
2014/2015
Graph 28: Sunflower production per province from 1993/1994 to 2014/2015
Limpopo
Free State
Mpumalanga
Gauteng
North West
ႈႂ