
THE
GRAIN AND OILSEED INDUSTRY
OF SOUTH AFRICA – A JOURNEY THROUGH TIME
ႇႈ
Registered cultivars 2013
Akwa (254)
Harts (254)
Kwarts (254)
Phb 96B01 R (411)
Anel (254)
JL 24 (959)
Rambo (254)
Phb 95Y41 R (411)
Billy (254)
Kangwane Red (254) Sellie
Phb 95Y40 R (411)
Robbie
PAN 9212
Tufa (254)
Phb 95Y20 R (411)
Mwenje (1137)
SA Juweel (254)
Inkanyezi (959)
Phb 95B53 R (411)
Nyanda (1173)
Health. Physical tests are done on samples and samples of all batches before they
may be sold.
Cultivars
South Africa almost exclusively produces the Spanish type of groundnut, and even
though research regarding the development of groundnut cultivars is a priority,
only the following approved cultivars were available in South Africa in 2013:
90,00
80,00
70,00
60,00
50,00
40,00
30,00
20,00
10,00
0,00
Tons (thousand)
1993/1994
1994/1995
1995/1996
1996/1997
1997/1998
1998/1999
1999/2000
2000/2001
2001/2002
2002/2003
2003/2004
2004/2005
2005/2006
2006/2007
2007/2008
2008/2009
2009/2010
2010/2011
2011/2012
2012/2013
2013/2014
2014/2015
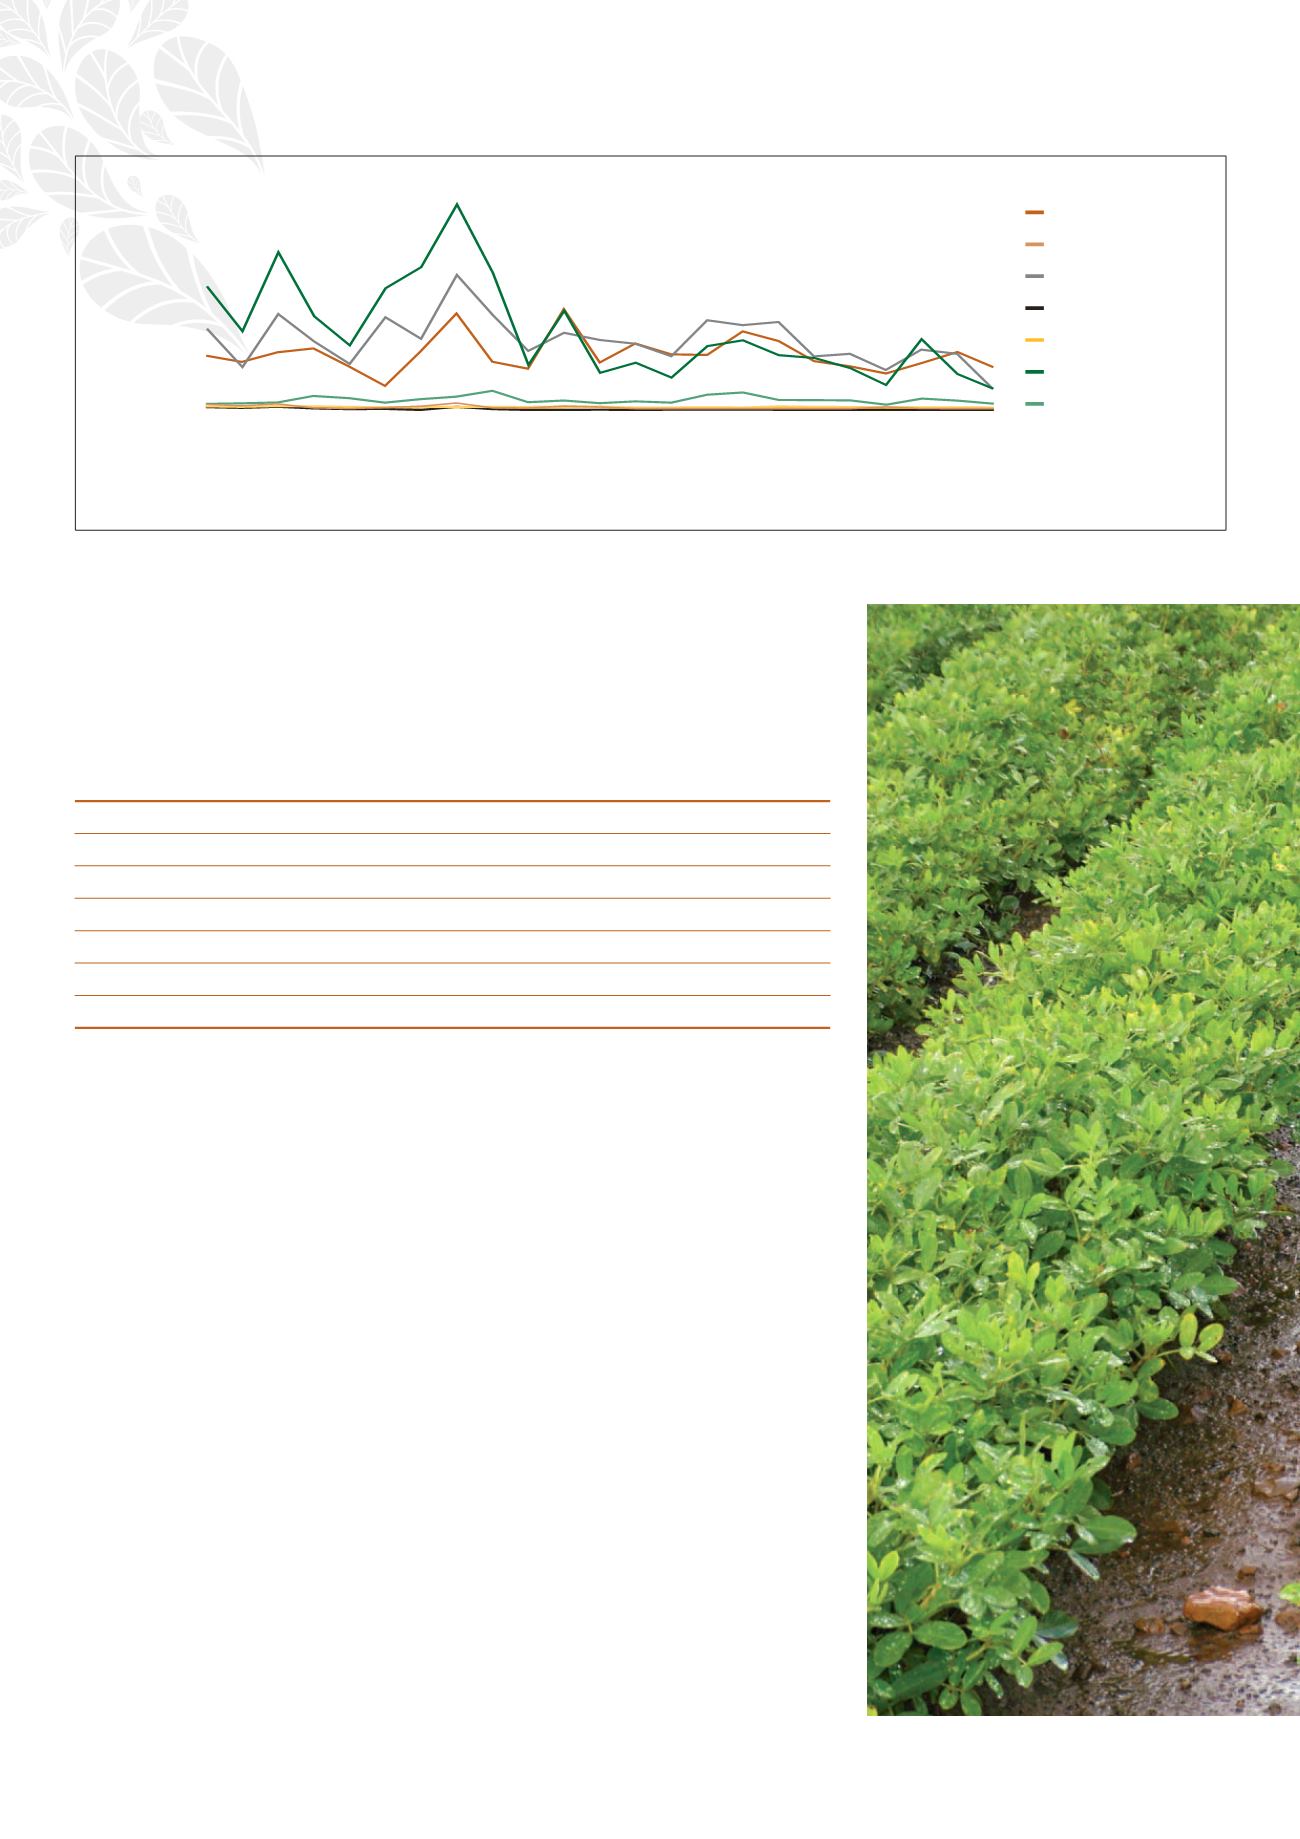
Graph 23: Distribution of groundnut production per province since 1993/1994
Northern Cape
Free State
KwaZulu-Natal
Mpumalanga
Gauteng
North West
Limpopo
In the light of the growing demand for groundnut varieties that deliver higher
yields, the ARC conducted research about this during 2011 and 2012 in various
large groundnut producing countries. The ARC concluded that the best alternative
would probably be for South Africa to import seed for reproduction from Senegal.
In 2012 it was also established that certain larger role-players in the industry had
imported new breeds/varieties independent of the ARC in an attempt to increase
production yields. They were dissatisfied with the ARC’s breeding programme
regarding varieties that could deliver better yields.
Marketing
Under the control of the Oilseeds Board, groundnuts were marketed according to
a single-channel system with prices determined by the Oilseeds Control Scheme.
After control was abolished in 1997, the price of groundnuts was established in the
market place, driven by demand, supply and quality.
Graph 24 (on page 58) shows the annual change in groundnut prices compared to
tons produced from 1990/1991 to 2013/2014. It shows a clear correlation between
the total tons produced and the producer price, but indexed price comparisons
show that the producer price has been structurally higher than the historical price
since 2006/2007.
A study conducted by the Bureau for Food and Agricultural Policy (BFAP) in 2012
concluded that a lack of mutual trust in the groundnut industry’s value chain ham-
pered initiatives for growth and recovering economies of scale to ensure an ongo-
ing supply of high quality groundnuts to the market. The opinion was that a total
turnaround strategy in the industry in South Africa was necessary and it should be


