


 104 / 124

September 2015
102
A look at the soybean crop quality
of the 2013/2014 production season
O
f the 150 samples analysed for the purpose of this third
annual crop quality survey, 88% (132) were graded as
Grade SB1, and 18 of the samples were downgraded to
Class Other Soya Beans (COSB). During the previous two
seasons, 5% (2012/2013) and 15% (2011/2012) of the samples were
downgraded to COSB.
Nine of the 18 samples were downgraded as a result of the percent-
age other grain (mainly wheat and sorghum) present in the samples
exceeding the maximum permissible deviation of 0,5%. Four of the
samples were downgraded as a result of the presence of poisonous
seeds (
Crotalaria
sp.,
Datura
sp.,
Ricinis communis
) exceeding the
maximum permissible number, namely one per 1 000 g.
The remaining five samples were downgraded as a result of a
combination of one or more of the following deviations exceeding
the maximum permissible deviation: Percentage foreign matter,
other grain, sunflower seed, defective soybeans on the 4,75 mm
round hole sieve, poisonous seeds and undesirable odour.
Based on the samples received for this crop survey, Sclerotinia
did not pose any problems.
Sclerotinia sclerotiorum
, a fungus that
produces hard masses of fungal tissue, is also known as Sclerotinia.
The sclerotia consisting of a dark black exterior, a white interior
and a rough surface texture, varies in size and form. Besides seed
yield reductions, the disease also results in reduced seed quality
and seed contaminated with the black sclerotia of the fungus.
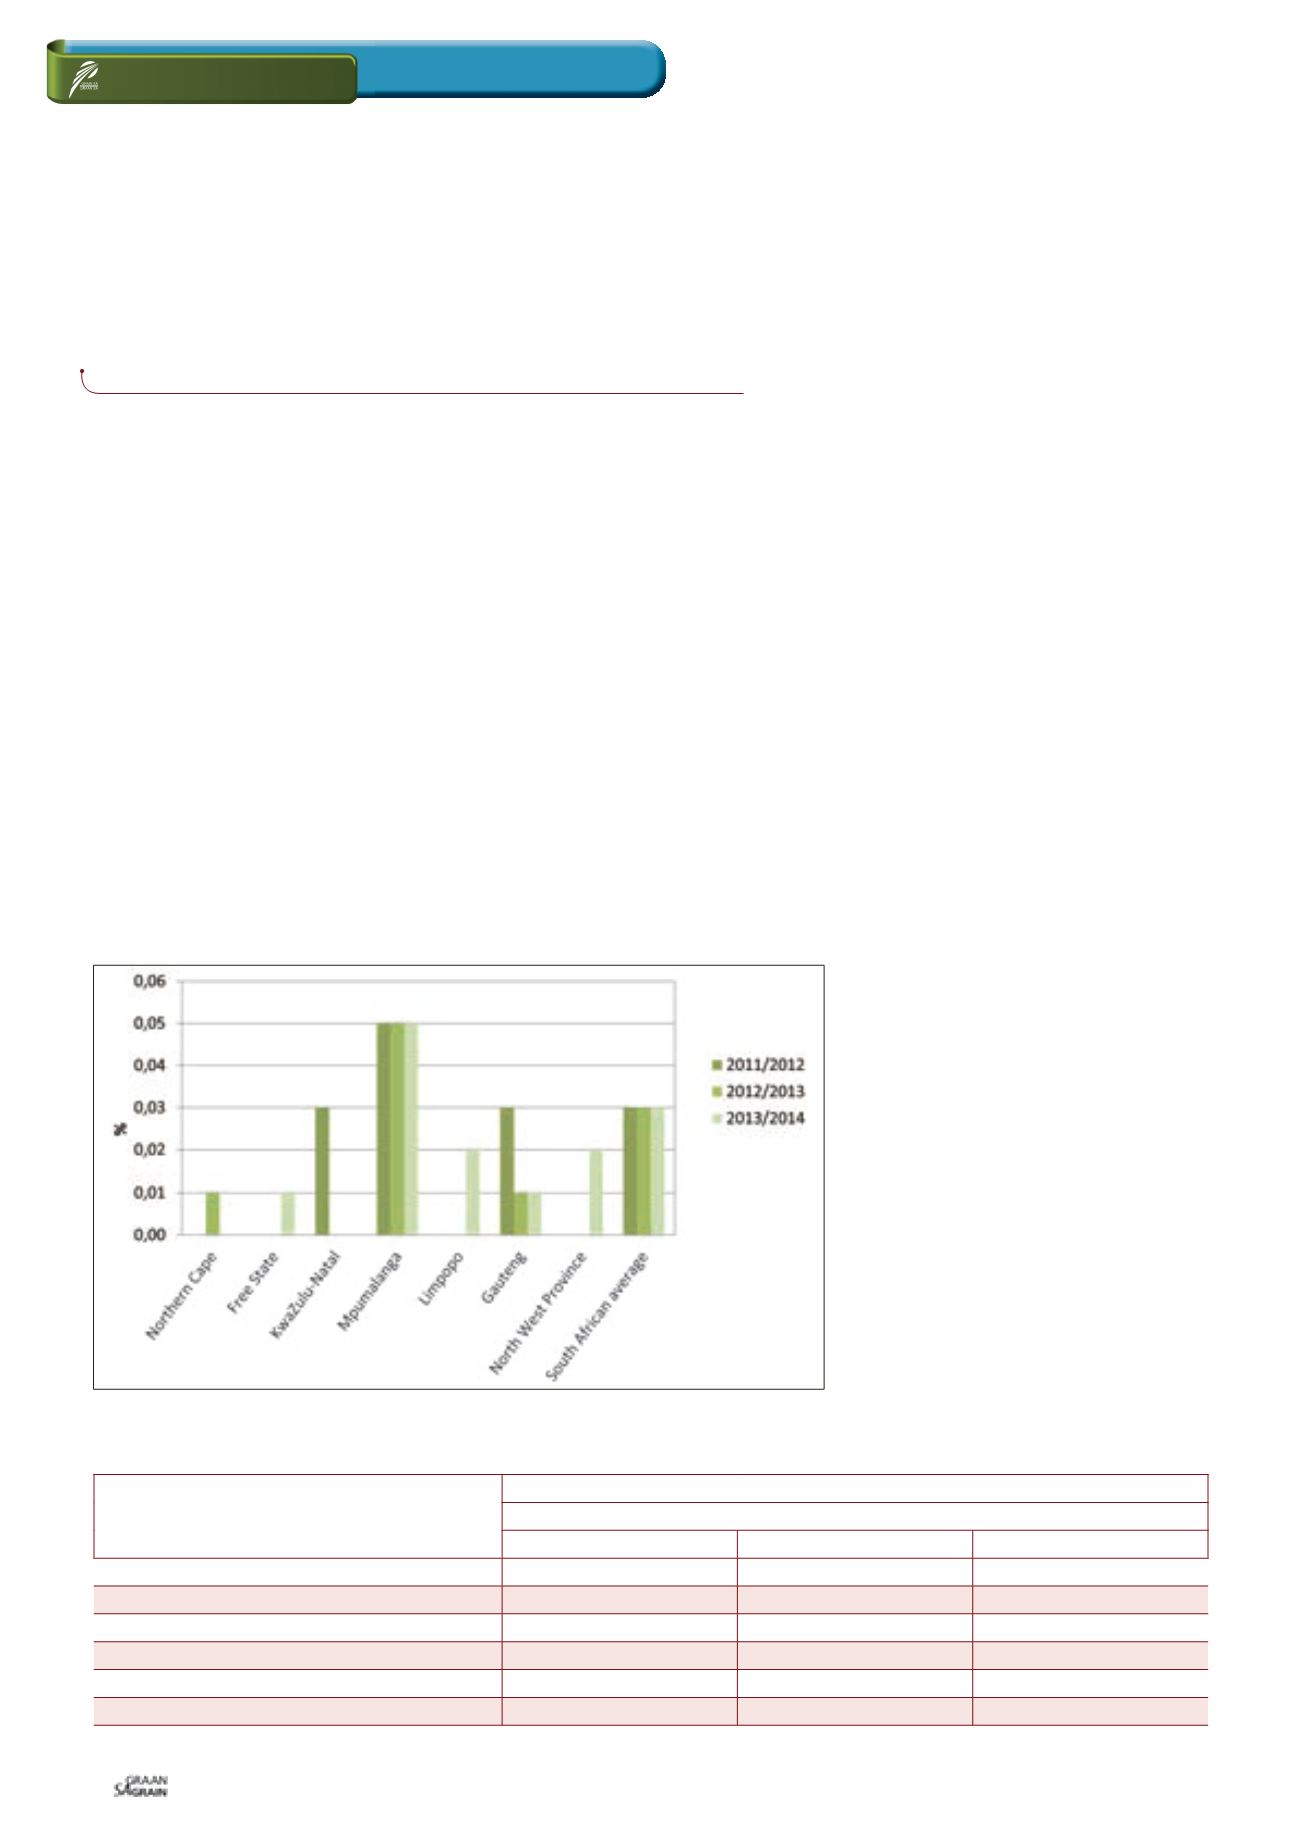
The highest percentage of Sclerotinia observed (0,40%) was on a
sample from Mpumalanga, which is still well below the maximum
permissible level of 4%. Over the last three seasons, Mpumalanga
consistently had the highest weighted average percentage of
Sclerotinia compared to the other provinces. The national weighted
average percentage over the last three seasons was 0,03%.
Gauteng province (seven samples) reported the highest weighted
average percentage soybeans and parts of soybeans that can pass
through the 4,75 mm round hole screen, namely 2,02% and Lim-
popo (three samples) the lowest at 0,42%. Mpumalanga, with the
highest number of samples (67), reported an average of 1,50%. The
Free State averaged 1,34% (51 samples). The national weighted
average percentage over the last three seasons decreased from
2,97% in the 2011/2012 season to 1,36% this season. No samples
were received from KwaZulu-Natal for the 2013/2014 season.
The weighted average percentage soiled soybeans of 0,89% is
higher than the 0,41% of the previous season, but well below the
weighted average (1,60%) of the 2011/2012 season. This season,
only six samples in total had soiled soy-
bean percentages exceeding 5% and none
exceeded the maximum permissible devia-
tion of 10%.
Hectolitre mass (test weight) does not
form part of the grading regulations for
soybeans in South Africa. An approximation
of the hectolitre mass of South African
soybeans is provided in
Table 1
for infor-
mation purposes.
The grams per 1 litre of filling weight of the
150 soybeans samples were determined
by means of the Kern 222 apparatus.
The hectolitre mass was extrapolated by
following the formulas obtained from the
Test Weight Conversion Chart for Soybean
of the Canadian Grain Commission.
RELEVANT
JOLANDA NORTJÉ,
manager: Laboratory, The Southern African Grain Laboratory NPC
PROVINCE
HECTOLITRE MASS, KG/HL
2013/2014 SEASON
WEIGHTED AVERAGE
RANGE
NO OF SAMPLES
Free State (regions 21 - 28)
71,1
66,6 - 73,6
51
Mpumalanga (regions 29 - 33)*
70,8
68,3 - 74,7
66
Limpopo (region 35)
69,7
68,5 - 70,5
3
Gauteng (region 34)
71,9
71,5 - 73,1
7
North West Province (regions 12 - 20)
71,2
69,4 - 73,1
20
South Africa
71,1
66,6 - 74,7
149
* One sample with an outlier value was not taken into account for calculation purposes
TABLE 1: APPROXIMATION OF HECTOLITRE MASS PER PROVINCE FOR THE 2013/2014 SEASON.
Graph 1: Average percentage Sclerotinia per province over the last three seasons.