


 105 / 124

103
September 2015
With gratitude to the Oil & Protein Seed Development Trust for financial support of these
annual surveys and to the members of Agbiz Grain for providing the crop samples.
These are: y = 0,1898x + 2,2988 (291 to
350 g/0,5 L) and y = 0,1895x + 2,3964 (351
to 410 g/0,5 L).
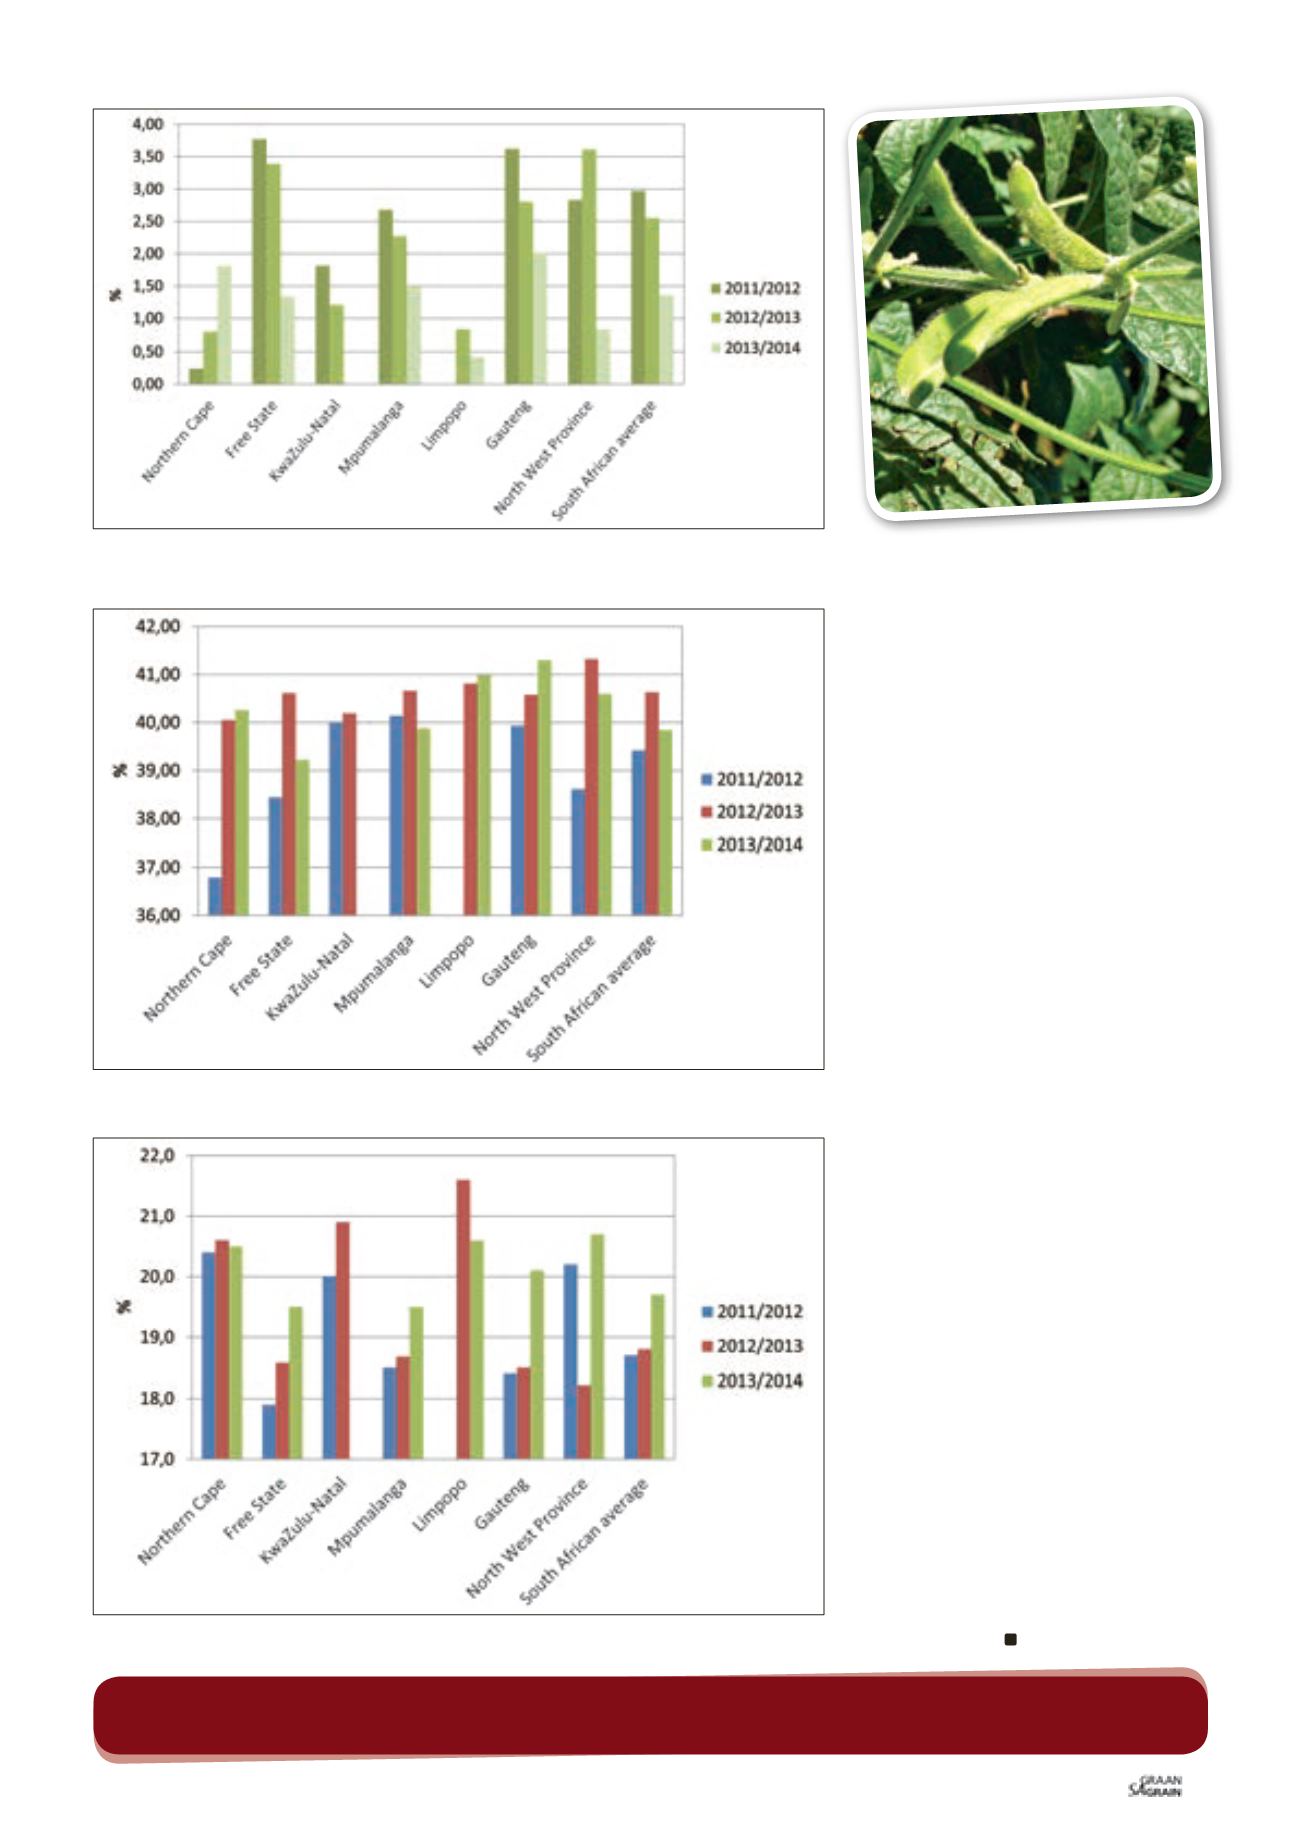
The protein, fat and ash components are
reported as % (g/100 g) on a dry/moisture
free basis. The average crude protein
content of the 2013/2014 season was
39,84% – 0,79% lower than the 40,63% of
the previous season.
Gauteng showed the highest weighted
average crude protein content of 41,30%
and the Free State the lowest of 39,22%,
followed by Mpumalanga with 39,88%.
The average crude fat percentage increas-
ed from 18,8% in 2012/2013, to 19,7% this
season.
The samples from the North West Province
had the highest weighted average crude fat
content of 20,7%. The lowest average fat
contents were observed in the Free State
and Mpumalanga, both with 19,5%.
The national weighted average ash content
did not vary significantly over the last three
seasons, with 4,66% this season compared
to the 4,65% and 4,62% of the previous
two seasons. Samples from the Northern
Cape and Limpopo tend to show higher ash
contents, while those from Mpumalanga
tend to be lower. The weighted average
percentage crude fibre varied from 5,4%
in the Northern Cape to 6,3% in the Free
State and Mpumalanga. The South African
weighted average was 6,1%.
All 15 samples tested for genetic modifi-
cation (GM) by means of the EnviroLogix
QuickComb kit for bulk soybeans, tested
positive for the presence of the CP4 EPSPS
trait (Roundup Ready
®
).
Detailed results of this survey as well as
that of the previous two seasons are
available on the SAGL website (
www.sagl.
co.za
). The annual crop quality reports in
PDF format are also available to download
from the website.
Graph 2: Average percentage soybeans and parts of soybeans that can pass through the 4,75 mm
round hole screen per province over the last three seasons.
Graph 3: Average crude protein content per province over the last three seasons.
Graph 4: Average crude fat content per province over the last three seasons.