
Oktober 2017
46
Expansion of SA barley exports:
Are there opportunities?
O
ver the years, South African
whole barley has remained a
very small player in the export
market and has been almost in-
significant due to the fact that it is a niche
market. The barley industry is very con-
centrated mainly due to the fact that the
majority of barley is currently used for
brewing purposes within South Africa.
There has however been export movement
for malted barley, but volumes remain rela-
tively small.
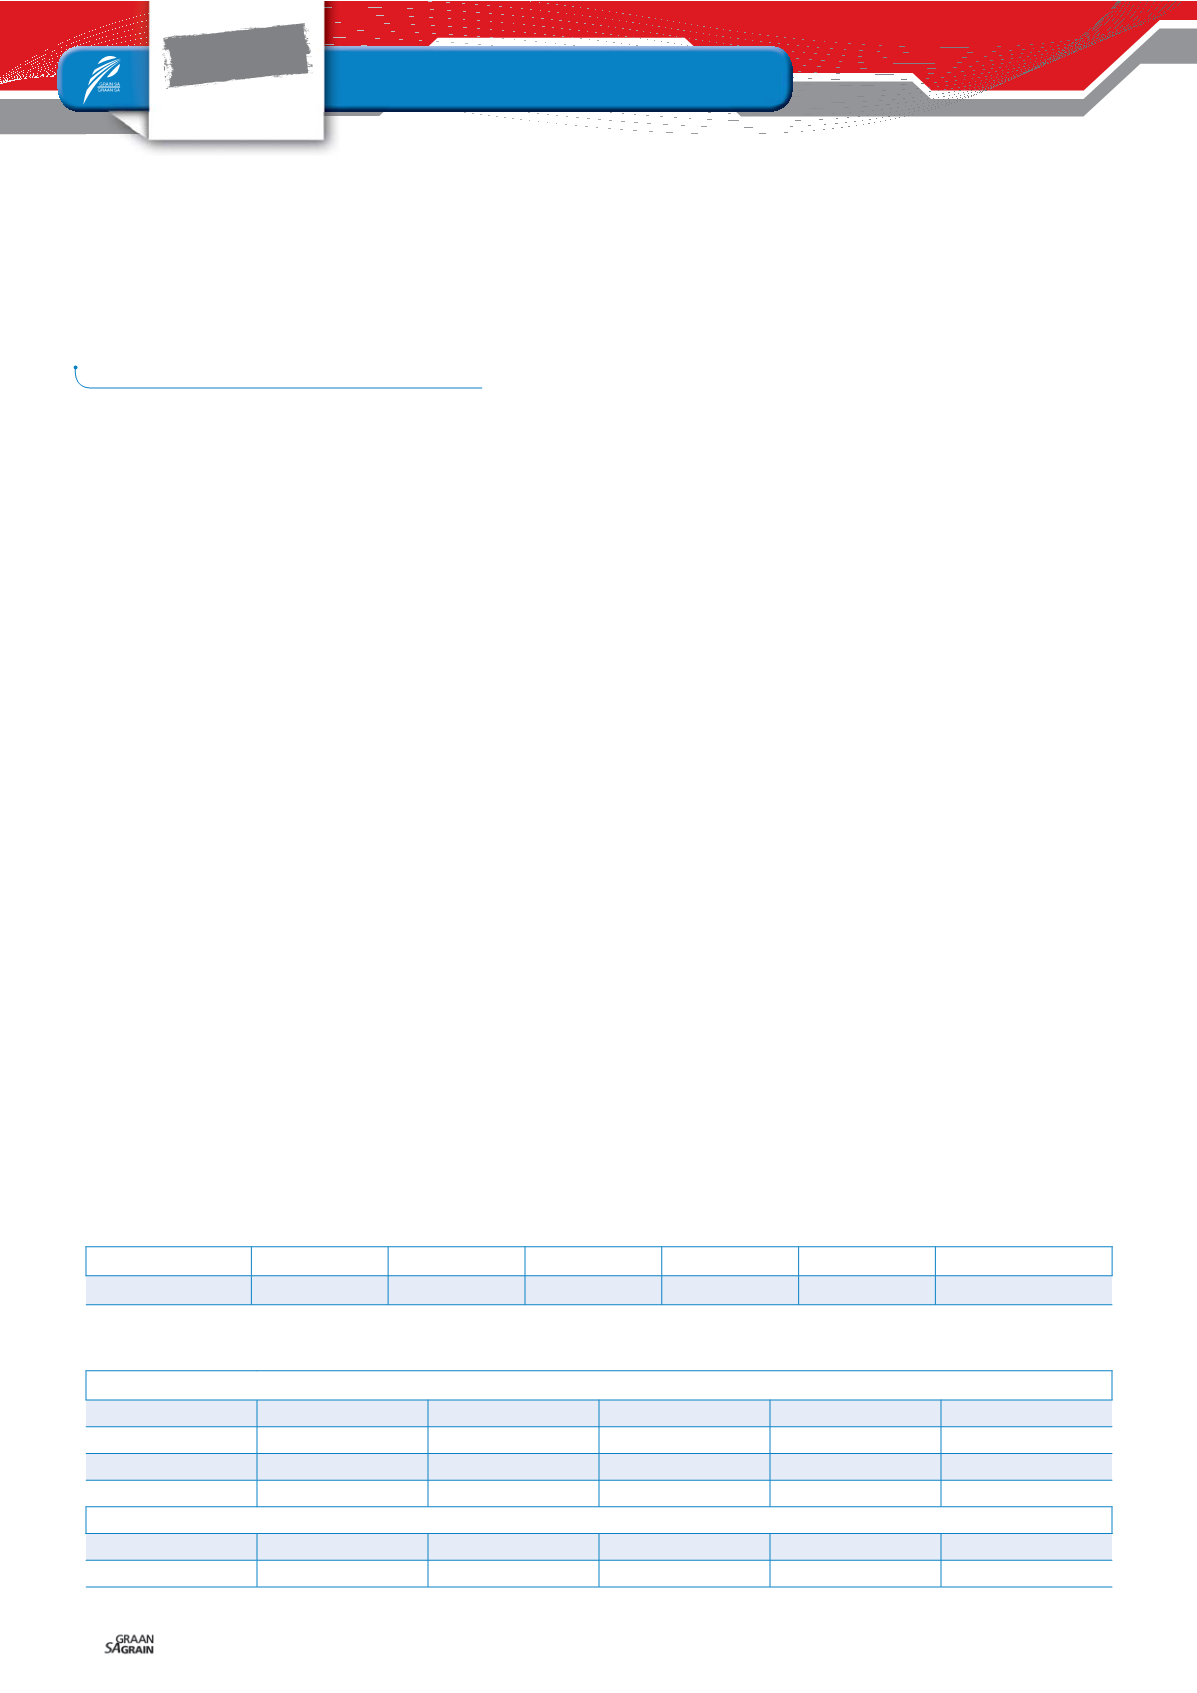
In the past five years, malted barley ex-
ports averaged 7 124 tons (
Table 1
), while
whole barley exports indicate a clear pic-
ture of a dead export demand. In the same
period under review, South Africa’s barley
imports averaged 56 000 tons, ultimately
making the country a net importer of barley.
About half of global barley production is
used for feed, followed by malting and fi-
nally human consumption. Only a portion
of the malted barley planted each year has
the specific qualities needed to be selected
for malt, therefore quality is quite stringent.
As barley in South Africa is mainly used
for brewing, it can be seen as a niche mar-
ket and for small producing countries; this
tends to tighten export market opportuni-
ties. It is against this background that this ar-
ticle seeks to uncover reasons for a stagnant
demand for malted barley and to discover
the possibility of creating export opportuni-
ties for the crop.
Global export market
Over the past five years, global barley ex-
ports averaged 31,6 million tons. The top
five leading exporters of barley are France,
Australia, Argentina, Germany and Russia.
Collectively, they account for more than
half of the global export market, at 63%.
Among countries in the African conti-
nent, Zambia and Kenya are within the top
50 exporters of whole barley, each ranking
40th and 43rd, respectively. Zambia and
Kenya are, however, very small play-
ers within the global export market, with
five-year average figures amounting to
3 258 tons and 1 140 tons, respectively. In
fact, both countries do not have a consist-
ent track record of barley exports. The main
importers of Zambian barley were Uganda
and Tanzania. However, both countries
posted declines in their imported quanti-
ties during the 2015/2016 marketing year
(
Table 2
).
Within the African continent, Libya is the
leading importer of barley and is among the
top 15 importers of the crop. On average,
Libya imports 583 624 tons of barley annu-
ally, with Ukraine as the leading exporter of
barley. In the 2016/2017 marketing year, Lib-
ya increased barley imports from Ukraine
twice in comparison with the previous sea-
son, with a share of Ukraine barley export
of 18,8%. Historically, Namibia sourced
whole barley from South Africa, with the
last export sale recorded in the 2013/2014
marketing year at just 24 tons. In 2015,
Namibia’s barley imports from the world
declined by 98% year-on-year. Owing to the
decline in Namibian imports was a success-
ful project by Namibian Breweries Limited
(NBL) to source home-grown barley by in-
creasing production.
The Namibian government availed 380 ha of
existing irrigation land to the project, spe-
cifically for the production of barley. Should
the project yield good quality crop, NBL
aims to increase year-on-year plantings by
1 500 ha per annum with the goal to gradu-
ally replace imports of about 40 000 tons of
malted barley. The world’s top five leading
barley importers are China, Saudi Arabia,
Netherlands, Belgium and Iran. In 2016, they
accounted for almost half of the global im-
ports of 27,5 million tons, at 49%.
Local production versus
import and export
In the 2014/2015 marketing season, South
Africa’s imports accounted for 17% of to-
tal supply (see
Table 3
), while in 2015/2016,
imports accounted for only 3,2% of the
total supply, outweighed by higher open-
ing stocks and commercial production of
211 000 tons and 330 000 tons, respectively.
Of the total barley produced in 2015, 2%
of malted barley was exported, which was
133% more than the value exported in the
year prior. South African imports have more
than doubled annually from 2012 to date,
while the exports remained in tight range
and relatively volatile due to inconsistency
in import demand from importing countries
such as Namibia.
FOCUS
Winter grain region
Special
MICHELLE MOKONE,
agricultural economist, Grain SA
MARKETING YEAR 2012/2013
2013/2014
2014/2015
2015/2016
2016/2017 FIVE-YEAR AVERAGE
Barley product
56
757
2 805
6 774
25 229
7 124
Source: SAGIS
TABLE 1: BARLEY PRODUCT EXPORTS FROM SOUTH AFRICA.
ZAMBIA BARLEY EXPORTS
2011
2012
2013
2014
2015
Zimbabwe
0
0
0
0
936
Uganda
0
0
0
10 475
282
Tanzania
0
0
108
944
0
KENYA BARLEY EXPORTS
2011
2012
2013
2014
2015
Uganda
0
0
0
1 529
0
Source: ITC
TABLE 2: ZAMBIA AND KENYA EXPORTS.


