
45
November 2015
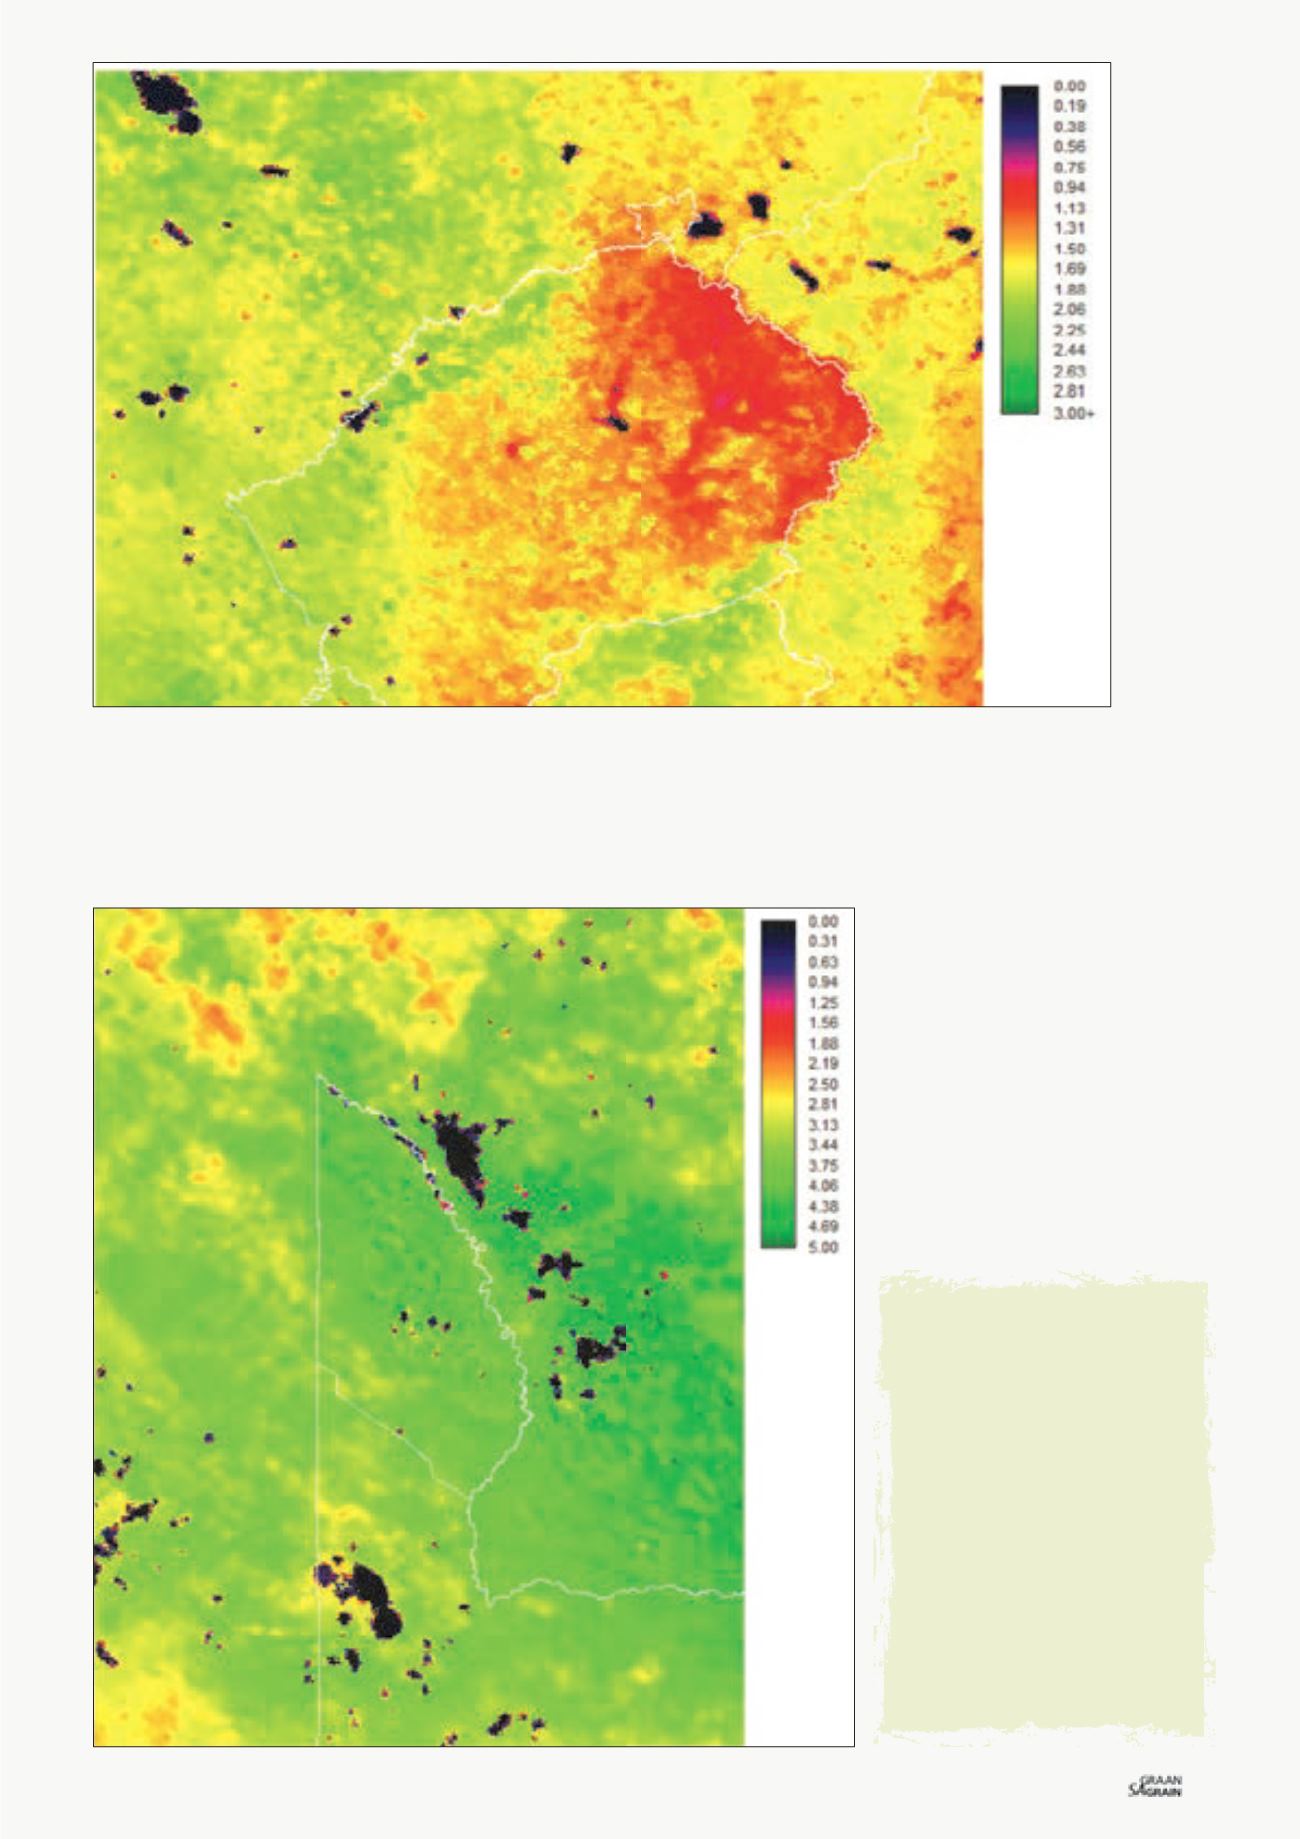
Figure 2: The contrast between South Africa and Lesotho for 2013 which reveals that in the low elevation, heavily grazed, low biomass sites
(south western parts), there is little difference in water use efficiency between South Africa and Lesotho, with the cross border values being
remarkably close to each other (approximately 2). In this south western part of Lesotho (e.g. the district of Mafeteng, as well as parts of the
Maseru and Mohales Hoek districts), the grass is kept very short by continuous grazing, or there is extensive dryland cropping in which the
residues are used to provide forage in the dry season. In contrast, the high lying areas of Lesotho in the north east, which fall inside the rain
shadow of the Drakensberg mountains, have a much lower water use efficiency (<1) than adjacent areas in South Africa (>2), which form
part of the Maloti-Drakensberg Transfrontier Park. This area is regarded as severely degraded, with extensive shrub encroachment, and the
water use efficiency index appears to be detecting this pattern.
“
It is therefore
important to
develop indices
that reflect the
functionality of
the ecosystem...
“
Figure 3: Some of the highest water use ef-
ficiency values in southern Africa are found
in the central Kalahari. This is a window
extracted from the 2013 image of water use
efficiency (Figure 1), and shows the boundary
between Namibia, South Africa and Botswana,
an area that is largely under conservation
management in the form of the Kgalagadi
Transfrontier Park. The dark black areas are
pans where no data is recorded. It is possible
that these high water use efficiency values can
be attributed to the water holding capacity
of the deep Kalahari sands, and the increase
in woody shrubs in this area in recent times.
However, a great deal more studies are needed
to confirm the underlying reason for these
high water use efficiency values.


