


 75 / 116

73
March 2016
South African soybean production has
always varied throughout the years, but
mostly above the domestic demand (see
Graph 1
).
However, from the 2013/2014 production
season, demand outstripped production
on the back of increasing demand from
the newly established crushing plants (see
Table 1
).
This gap is expected to widen in the
2016/2017 marketing season due to low-
er expected production on the back of a
drought.
Soybean production grew by 63% between
the 2011/2012 to 2014/2015 production sea-
sons. At the same time, the area planted
increased by 57%. The key underlying fac-
tor behind this growth was the demand
from the crushing plants. It is important to
highlight that of the estimated 2,2 million
tons plus of total crushing capacity, about
1,3 million tons are dual – meaning that it
can crush both sunflower seeds and soy-
beans (see Table 1).
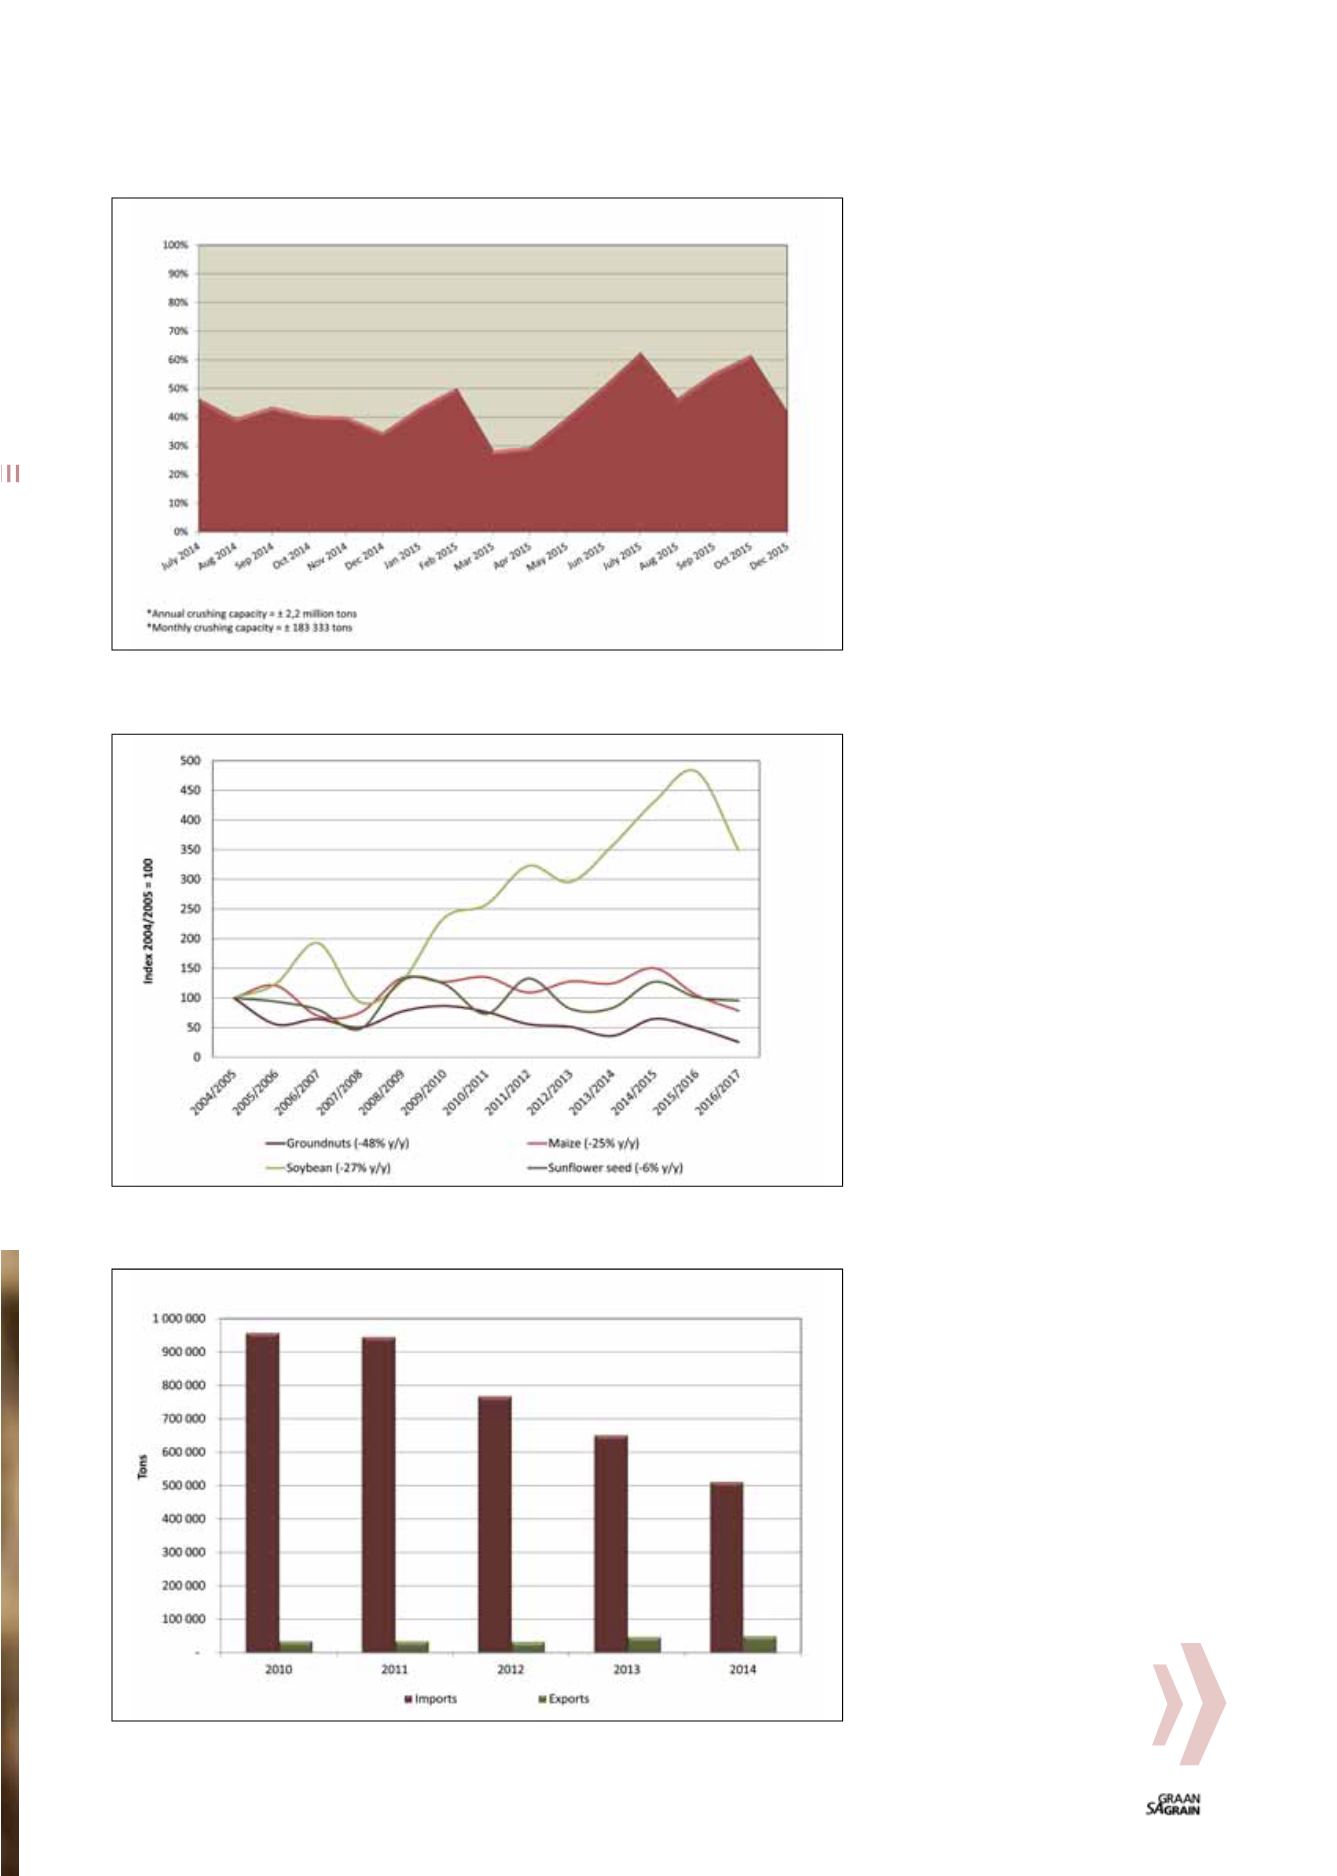
Moreover, the crushing plants are not yet
crushing at full capacity. The highest crush-
ing reached so far was 62% of the monthly
rate in July 2015 and December 2015 (see
Graph 2
). The reason for this might be at-
tributed to the current higher prices as well
as some mechanical issues within the firms,
as some were still in their final stages of
construction.
Closer look at production
South Africa’s 2016 total summer crop is
expected to decrease by 24% year-on-year.
Of these, soybean production is expected
to decrease by 27% year-on-year to
768 560 tons. This expected decrease in
production is due to the current drought
conditions which have led to a decrease
in area planted as well as possibilities of
lower yields.
Nonetheless, over the past twelve years the
soybean crop showed significant growth
when compared to maize, sunflower seeds
and groundnuts (
Graph 3
). Of all the afore-
mentioned crops, groundnuts is the only
crop that showed significant decrease,
due to a decrease in yields and domestic
demand, particularly in the edible peanut
market.
Over these years, soybean yield levels did
not show any significant changes. With
the exception of 2016/2017, national yields
averaged at around 1,21 tons per hectare.
It is worth noting that the crop increase in
2015/2016 would possibly have been higher
than the estimated 1 million tons’ produc-
tion, as the area planted increased 37%
year-on-year. However, this increase was
overshadowed by the current drought con-
ditions.
Graph 2: South African soybean monthly consumption versus estimated monthly crushing capacity.
Source: Grain SA (2016)
Graph 3: Summer grain production index.
Source: Grain SA (2016)
Graph 4: South African soybean oilcake imports and exports.
Source: Trade Map (2016)