


 77 / 116

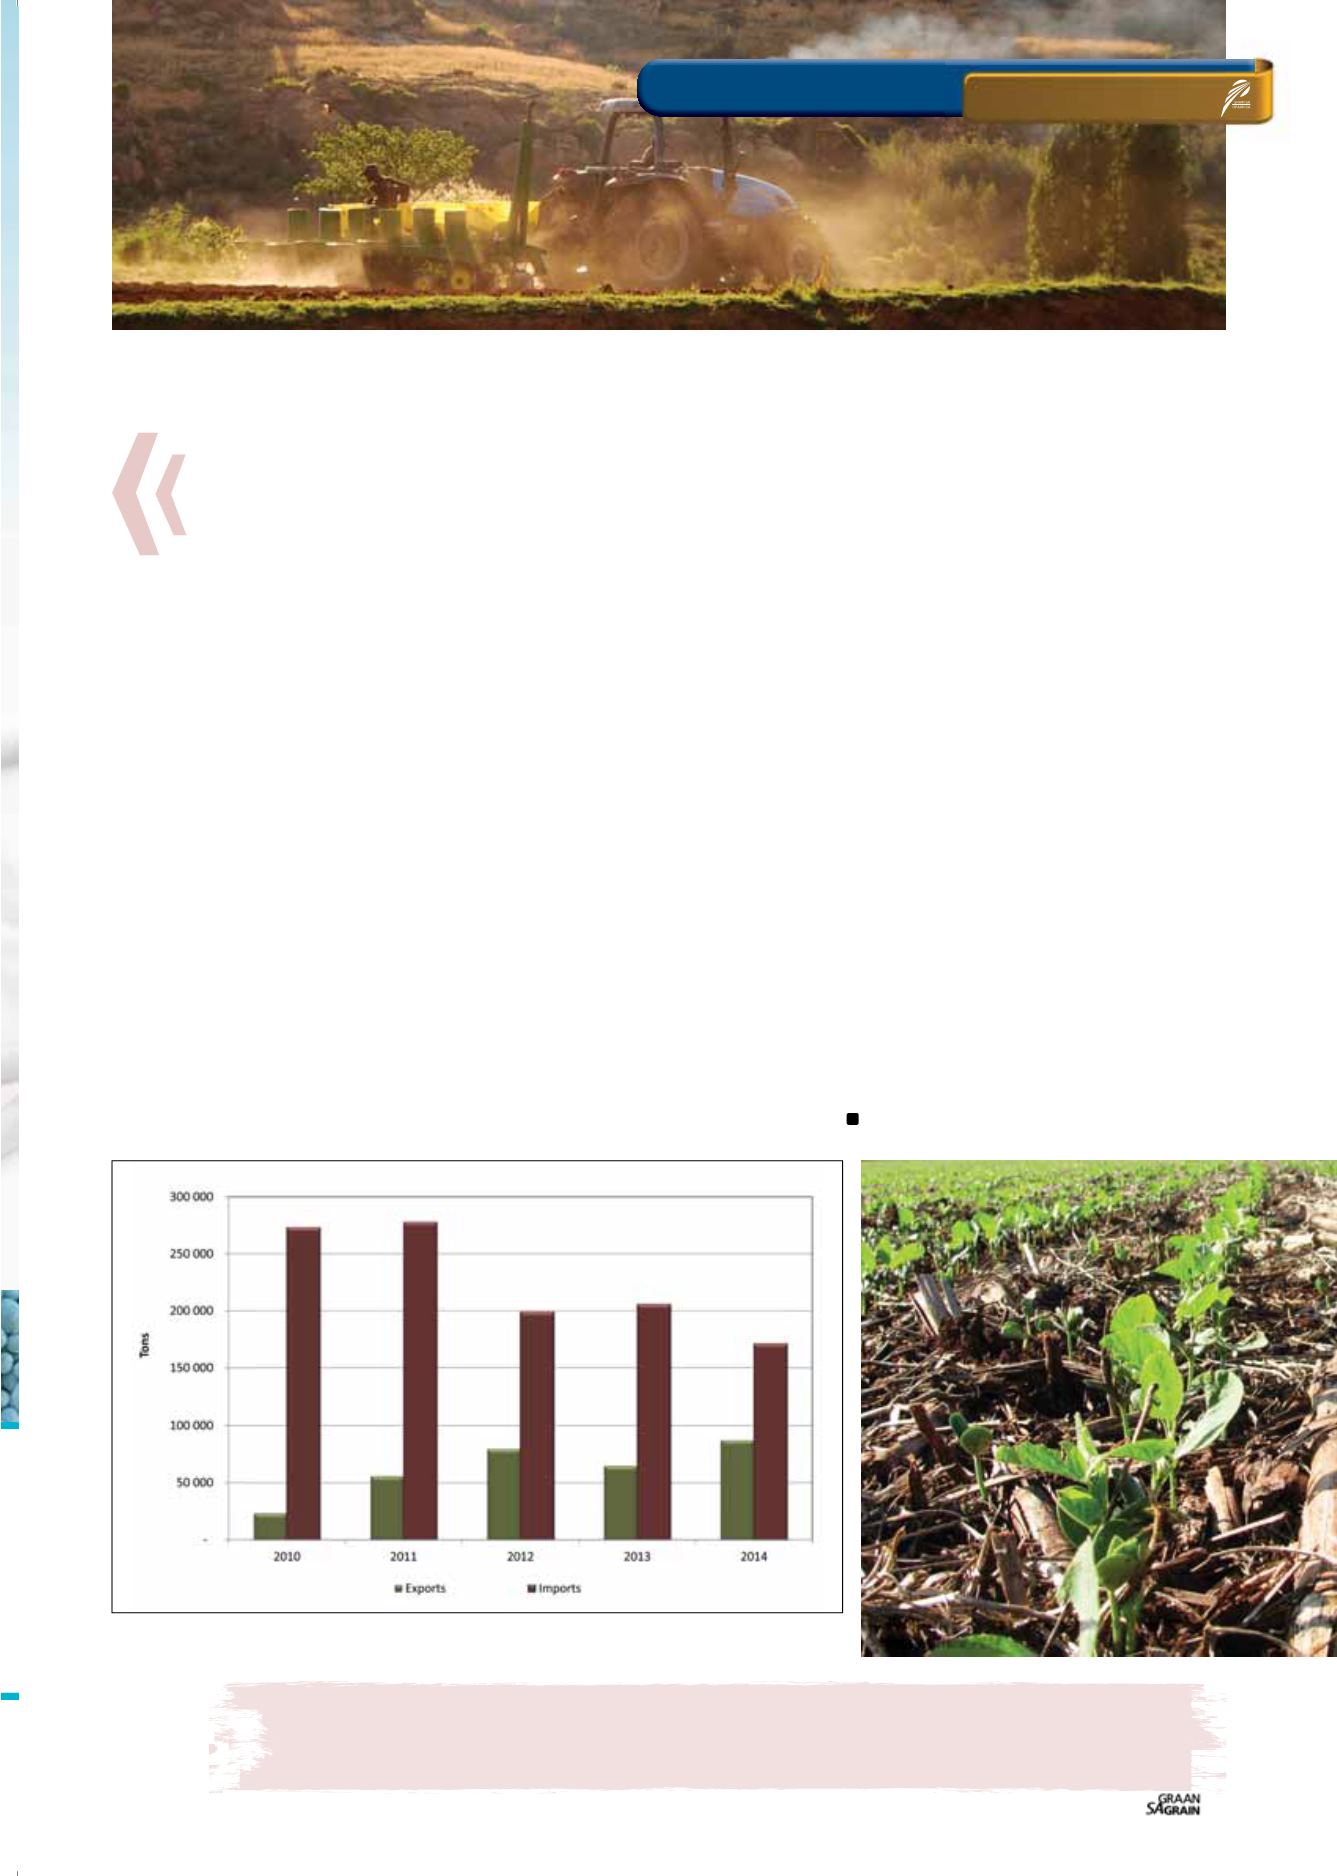
Graph 5: South African soybean oil imports and exports.
Source: Trade Map (2016)
Trade perspective
South Africa’s 2016/2017 soybean imports are estimated to be at
the highest levels in years due to expected significant drop in do-
mestic production. However, imports of soybean oilcake have been
decreasing.
Graph 4
represents the past five years of South African
oilcake imports. From 2010 to 2014, South African oilcake imports
have decreased by 47%.
This is positive for the economy and displays a positive gain from
the investments made in the processing industry (crushing plants).
From 2012 to 2014 South African oilcake imports decreased by
33%. This was during the period when some of the new crushing
plants came into effect.
The import decreases show positive results from the investment
made in pursuing the governmental import replacement strategy.
Nonetheless, South Africa still imports significant volumes of oil-
cake. The 2014 oilcake imports amounted to 511 014 tons, which is a
41% share of domestic consumption (see Graph 4).
The leading suppliers to South Africa were Argentina, with a share of
99% (506 900 tons) and Malawi with a share of 1% (2 814 ton). There
is still capacity to increase production and reduce these imports.
South Africa is a small player given the soybean oilcake export mar-
ket. In the past five years the industry has exported an average of
39 443 tons of oilcake. All exports were destined for the African mar-
kets, mainly Botswana, Mozambique, Namibia, Lesotho and Angola.
South Africa also imports significant volumes of soybean oil. Ac-
cording to Trade Map (2016) data in 2014, South Africa’s soy oil
imports totalled 171 068 tons. However, it is worth mentioning that
this was a 37% lower than the volume imported in 2010.
Like soybean oilcake imports, soybean oil imports also showed a
decreasing trend (see
Graph 5
). The leading soybean oil suppliers to
South Africa are Spain with a share of 44% (75 679 tons), Argentina
with a share of 27% (46 727 ton), the Netherlands with a share of
21% (35 969 tons), Romania with a share of 4% (6 493 tons) and Brazil
with a share of 3% (5 517 tons).
South Africa also exports soybean oil to the African markets. The
average for the past five years is 61 947 tons. In 2014, the leading
suppliers were Zimbabwe with a share of 61% (53 541 tons), Zam-
bia with a share of 36% (19 198 tons), Malawi with a share of 4%
(3 416 tons), Swaziland with a share of 4% (3 369 tons) and Lesotho
with a share of 4% (3 263 tons).
Conclusion
The South African soybean industry is negatively affected by the
current drought. Nevertheless, the industry has grown significantly
and there remains a potential for further growth to utilise the crush-
ing capacity.
Investments made as part of import replacement have yielded
positive results; imports for both soybean oilcake and oil have de-
creased significantly. But, there is still a need to substitute the cur-
rent imported quantity with domestic production. It is important
to highlight that any production increases from the current crop
size might have an impact on the price levels, and therefore, the prof-
itability of the crop.
GRAIN MARKET OVERVIEW
Disclaimer
Everything has been done to ensure the accuracy of this information, however Grain SA takes no responsibility
for any losses or damage incurred due to the use of this information.
Grain SA
/
Sasol Base Chemicals photo competition
– Amanda van Blerk 2015
Grain SA
/
Sasol Base Chemicals photo competition
– Piet Lombard 2014
75
March 2016
ON FARM LEVEL