


 50 / 64

Februarie 2017
48
ON FARM LEVEL
Quality
COUNTRY OF ORIGIN
MEXICO
SOUTH AFRICA
USA
CLASS AND GRADE WHITE MAIZE
WM1
AVERAGE
WM1
AVERAGE
WM2
AVERAGE
Physical factors
100 kernel mass, g
38,3
37,7
30,9
31,1
31,3
31,3
Stress cracks, %
13
12
6
6
34
34
Milling index
95,9
88
100,6
100,4
89,8
89,8
Number of samples
33
60
402
485
2
2
COUNTRY OF ORIGIN
MEXICO
SOUTH AFRICA
USA
CLASS AND GRADE WHITE MAIZE
WM1
AVERAGE
WM1
AVERAGE
WM2
AVERAGE
Whiteness index, 87:13, sifted
19,1
19,3
15,3
14,9
21,4
21,4
Whiteness index, unsifted
27,9
28,4
23,4
22,9
30
30
Number of samples
28
49
397
480
2
2
TABLE 4: PHYSICAL FACTORS.
TABLE 5: WHITENESS INDEX.
TABLE 3: MILLING INDEX SCALES.
Source: SAGL
Source: SAGL
Source: SAGL
MILLING INDEX MEASUREMENT
MILLING QUALITY
< 60
Bad milling quality
60 - 80
Acceptable milling quality
80 - 100
Good milling quality
100 - 120
Excellent milling quality
> 120
Exceptional milling quality
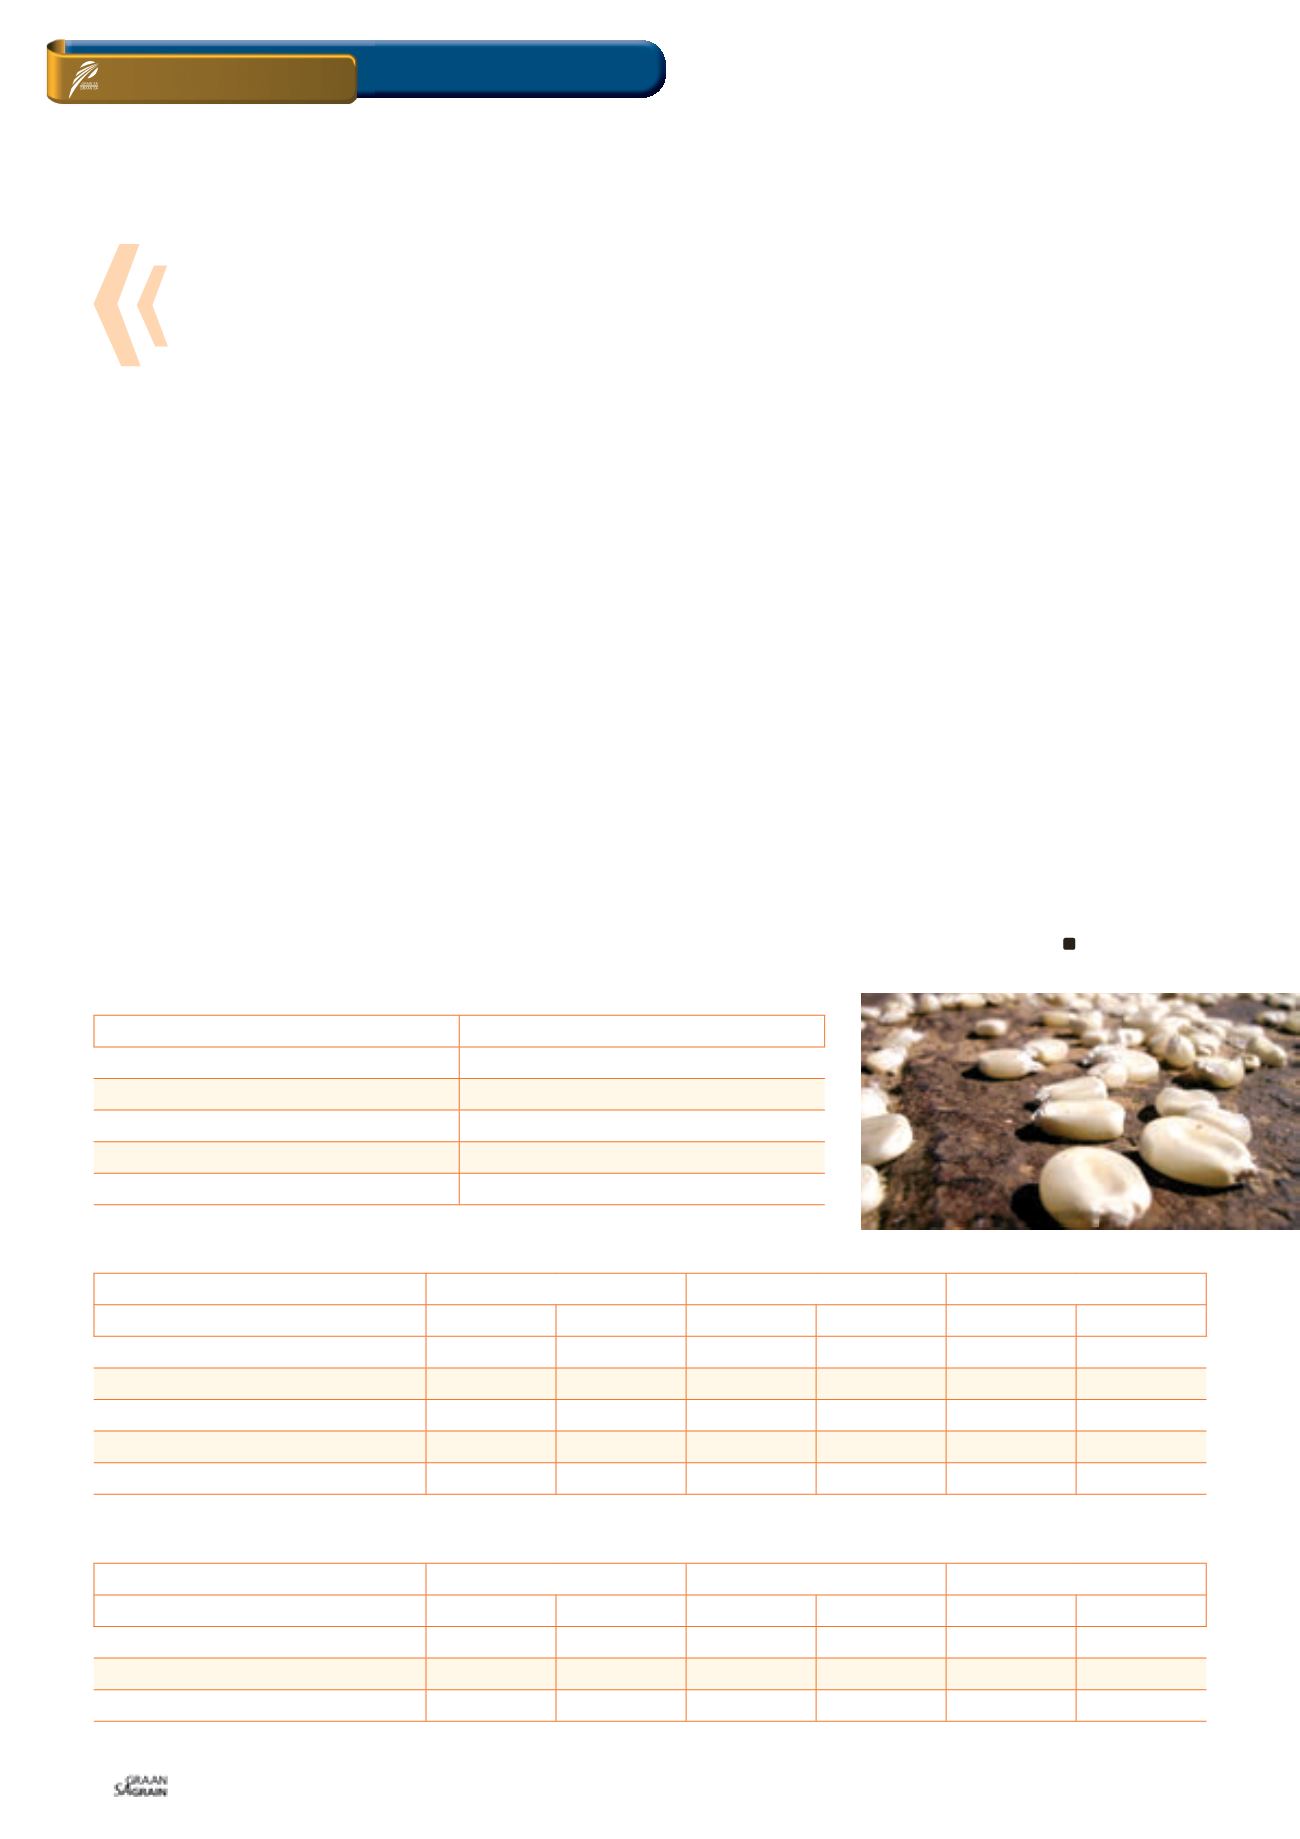
This can easily result in losses when looking at the milling process,
especially on the quantity lost before milling.
When the physical characteristics are compared, the Mexican
maize have a higher kernel mass, but the most important factors
are the stress cracks and the milling index. The milling index is still
an index and not an exact figure, though. It is important to view
the index according to a scale as set out below.
According to the scale referred to above and the findings of
SAGL, the milling quality of all three regions is within the good
milling quality scale. None of the regions’ maize can be categorised
as bad milling quality in terms of the milling index. However, it is
clear that the imported maize has higher stress crack percentages
and this can result in losses when milling.
In terms of whiteness the imported maize is actually performing
very well and has an even higher index than the local maize. Keep
in mind that this index is determined after milling and not on the
whole grain.
One important factor for the South African consumer is the my-
cotoxin levels. According to the local standards the Fumonisin B1
and B2 must be below 4 000 micrograms/kg. The tested samples
from the imports were for FUM B1 at 1 176 micrograms/kg and
Fum B2 at 316 micrograms/kg. This is well below the standards and
therefore can be safely consumed in South Africa.
In summary, the imported maize can compare with South African
maize based on the milling and nutrient samples. Various losses
occur due to breakages of kernels, stress cracks and defective ker-
nels. This means that there can be losses due to handling and trans-
portation before it enters the mill, which leads to the fact that local
maize can trade at a premium – due to limited physical losses, mean-
ing better profits.
How can producers make sure that these
premiums can be obtained?
Since there is a high demand for local white maize, it means that
the producer can obtain a better basis in terms of physically selling
the commodity – keep in mind though that this is for the physical
commodity.
To obtain these premiums you must have the physical maize and
you must negotiate with buyers. This means that the producers need
to talk to a few buyers in order to obtain the best basis.
Keep in mind though that a proper calculation must also be done in
terms of carrying costs. This means one must calculate the costs of
storage and interest rates until the sale takes place. The additional
premium on the basis must exceed these costs to make such a deal
profitable.
Another method is to make use of the JSE’s physical trading sys-
tems where you can trade your physical maize at a specific location
for an additional premium. Some local agribusinesses also have
basis trading available where you can sell your physical maize at a
specific silo for a premium.
In a marketing year with shortages clever marketing must be used
in order to obtain the best basis for your commodity. This is mainly
possible due to the high demand for local maize, whereas in normal
marketing years these opportunities do not exist.
White maize quality comparisons
Grain SA/Sasol photo competition