
Februarie 2016
40
Where are the grain imports going to
come from?
The resultant effects of the expected steep declines in maize
production are significant maize imports. The expectation is that
South Africa (including Botswana, Lesotho, Namibia and Swaziland
[BLNS]) may import at least 5 million tons of maize (1,7 million tons
white, and 3,3 million tons yellow).
Zimbabwe will expectedly import 1,2 million tons of maize (Agbiz,
2016, USDA, 2016 and ReNAPRI, 2016). In contrast, minimal im-
ports are expected in Tanzania with good rainfall supporting pro-
duction estimates of above 6 million tons (SADC FSEWS, 2016 and
ReNAPRI, 2016).
Meanwhile, recent reports have highlighted that Zambia might
be compelled to import, even though an estimate is not yet avail-
able. Zambia’s maize balance sheet seems to suggest, however, that
they can rely on their carryover stocks and a 500 000 tons strategic
grain reserve that could minimise the level of imports.
This means that Zambia’s capacity to export into the region is cur-
tailed. The aggregate picture of the regional total maize imports
could be at least 7 million tons, most if not all, of which are from
deep sea imports.
The question then is, from which countries will Southern Africa im-
port the much-needed (white) maize?
Of the expected 7 million tons of imported maize required for the re-
gion, at least half of it should ideally be white maize meant for human
consumption (authors’ calculations).
The issue of SADC maize import requirements needs to be an-
swered concurrently with how much white maize is available in the
global market. While yellow maize is readily available in the global
market, white maize remains in limited supply amid a growing import
need in the Southern African region and some few Latin American
countries.
Outside of the African continent, white maize is mainly produced
in Mexico, with current surplus stocks of at least 1,5 million tons of
non-GMO white maize available for export markets.
Is the infrastructure going to be able to
handle expected import requirements?
If the region becomes entirely dependent on deep sea imports,
it brings the important question of whether the port capacity will
manage to handle an unprecedented level of grain imports.
The question of whether infrastructural capacity is sufficient to
meet at least 6,2 million tons of maize imports and an additional
5 million tons of other grains (e.g. rice, soybean and soybean oilcake
and wheat) is a question that is yet to be answered satisfactorily.
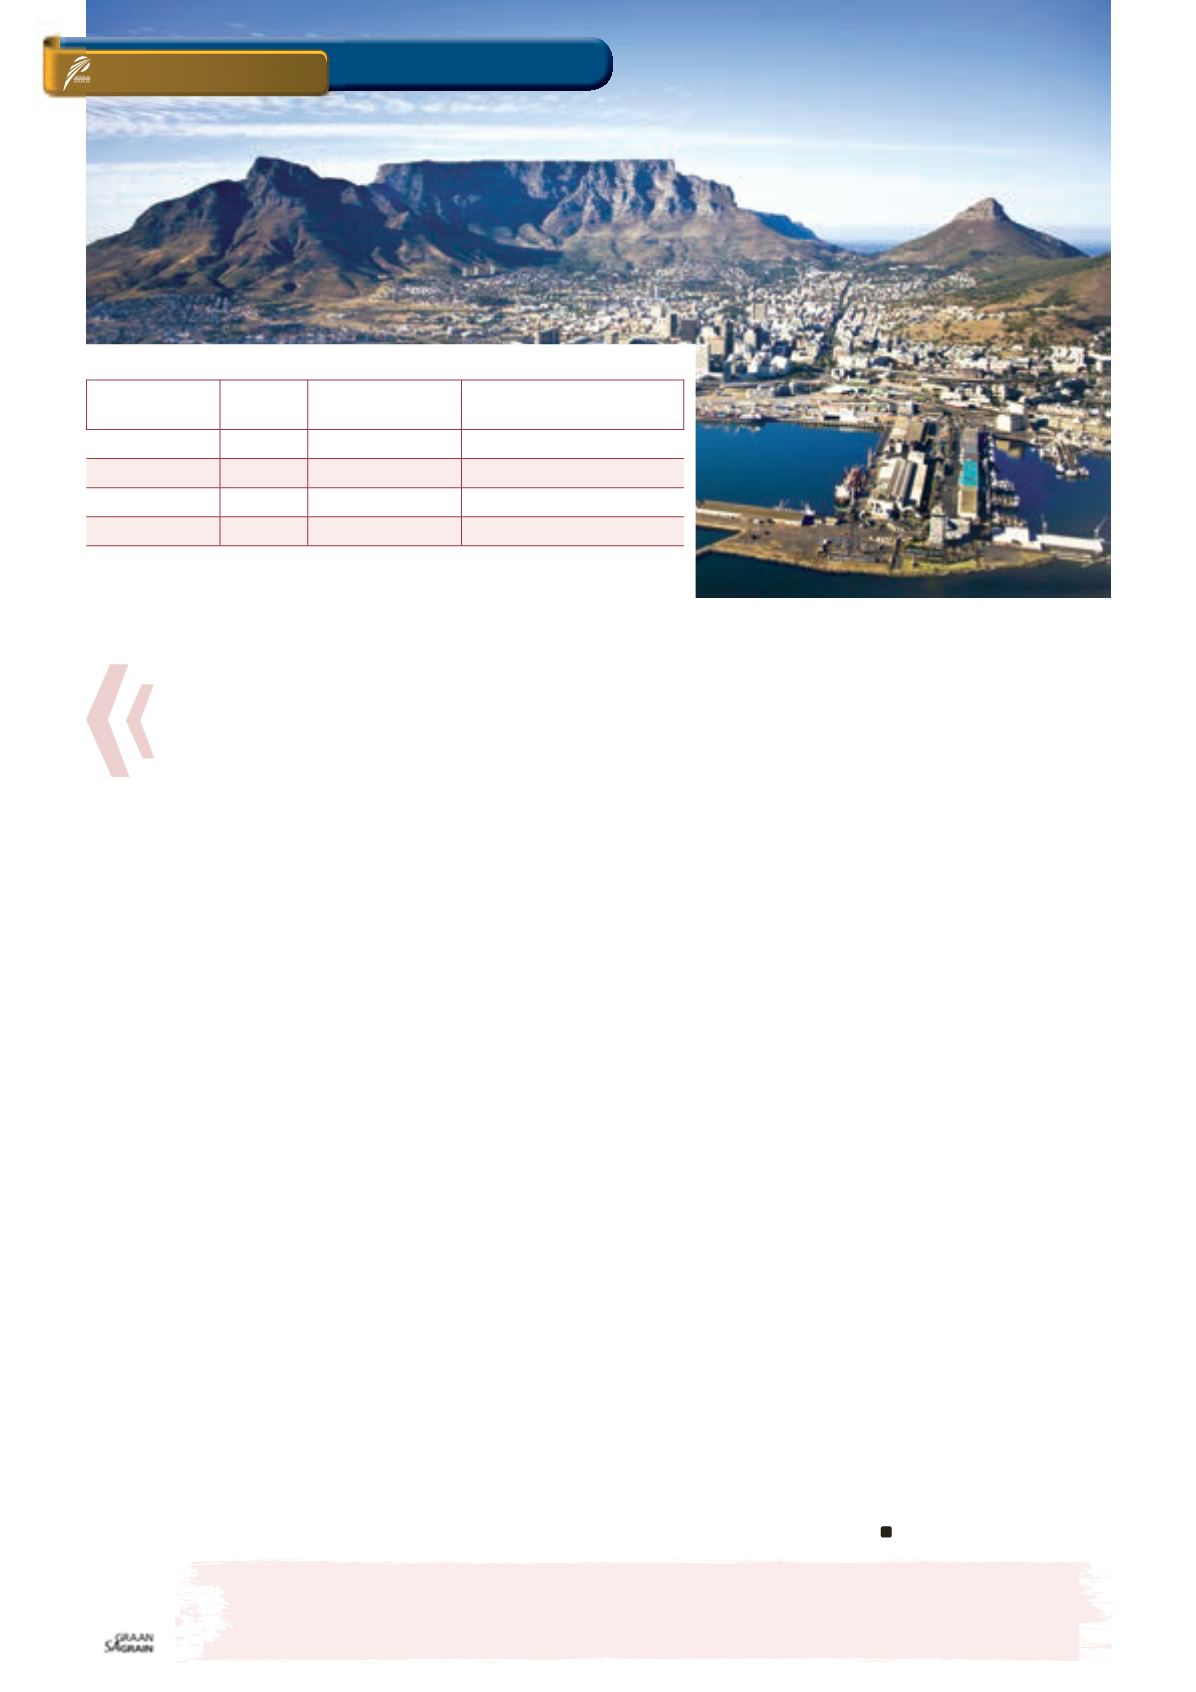
In the recent past, South Africa mainly used the Durban, Cape Town,
Port Elizabeth and East London ports – all of which have a combined
capacity of roughly 4,8 million tons (refer to
Table 1
).
However, while it is unclear what the maximum grain import
capacity is, industry experts suggest that ports have an addition-
al capacity to handle imports of roughly 7 million tons. Moreover,
there are arguments that suggest the creation of additional capac-
ity in ports that are traditionally non-grain importing ports, such as
Richards Bay. Emerging concerns relate to the potential traffic con-
gestion at the ports and on roads – which will affect the turn-around
time of grain trucks. This point is particularly important if we con-
sider that 80% of all grain transported inland is done by road.
The potential problem of traffic congestion could be averted, or
at the very least lessened by the possibility of increasing the use
of rail transport as an alternative. Provisional estimates from
Transnet show that out of the 308 wagons in their fleet, there are
108 wagons that are grain containers – which have a capacity to
transport 7 920 tons per day (Transnet, 2016; authors’ deductions).
Conclusions
All of the estimates regarding the import requirements and port
capacity are based on expect speculations and in certain cases
opinions, which might not necessarily reflect the outcome. It is
also important to note that the summer crops are still in early
growing stages, hence there is no certainty about the final crop
production volumes. All these factors will affect the import volumes
and prices, but the emerging outcome will be much clearer within
the next two to three months, once crop assessments have been
completed across the SADC region.
GRAIN MARKET OVERVIEW
ON FARM LEVEL
PORT
DRAFT
GEARED
VESSEL
AVERAGE DISCHARGE
RATE PER MONTH (TONS)
Cape Town
11,9 m
Yes
140 000
Port Elizabeth
10,8 m
Yes
70 000
East London
10,4 m
Yes
66 000
Durban
10,2 m
n/a
130 000
TABLE 1: SOUTH AFRICA’S PORT CAPACITY.
Disclaimer
Everything has been done to ensure the accuracy of this information, however Grain SA takes no responsibility
for any losses or damage incurred due to the use of this information.
Source: Ports authority (2016)


