


 64 / 73

THE
GRAIN AND OILSEED INDUSTRY
OF SOUTH AFRICA – A JOURNEY THROUGH TIME
ႈႆ
Production areas
Not all the provinces in South Africa are equally suitable for the production of soy-
beans. For example, during the 2013 season it was reported that soybeans were
mainly cultivated in the Free State (42%), Mpumalanga (40%) and KwaZulu-Natal
(6%). However, small crops were found in Limpopo, Gauteng and North West.
Canola
Production
Canola is a winter crop that needs relatively cool, moist conditions for the best
results, especially in the flowering, pod-forming and seed-setting stages. In South
Africa canola can be cultivated in all areas where wheat is grown, but it does not
produce the same good results everywhere. Currently (2016) commercial canola
cultivation takes place mainly in the Western and Southern Cape.
In South Africa only canola
brassica napus
is cultivated commercially.
As in the case of wheat, canola cultivars are mainly classified according to their
need for cold. It is divided into winter types, intermediary types and spring types.
These names have little to do with the time of year when it is planted, but more
with the cultivars’ need for cold. The spring type is the most suitable for South
African conditions.
Canola is very suitable for a rotation system with wheat, as it contributes very well
to the quality of the soil and facilitates weed control in the field. Changing from
wheat to canola production does not necessarily require a big additional capital
investment, as many of the implements used are the same as those for wheat pro-
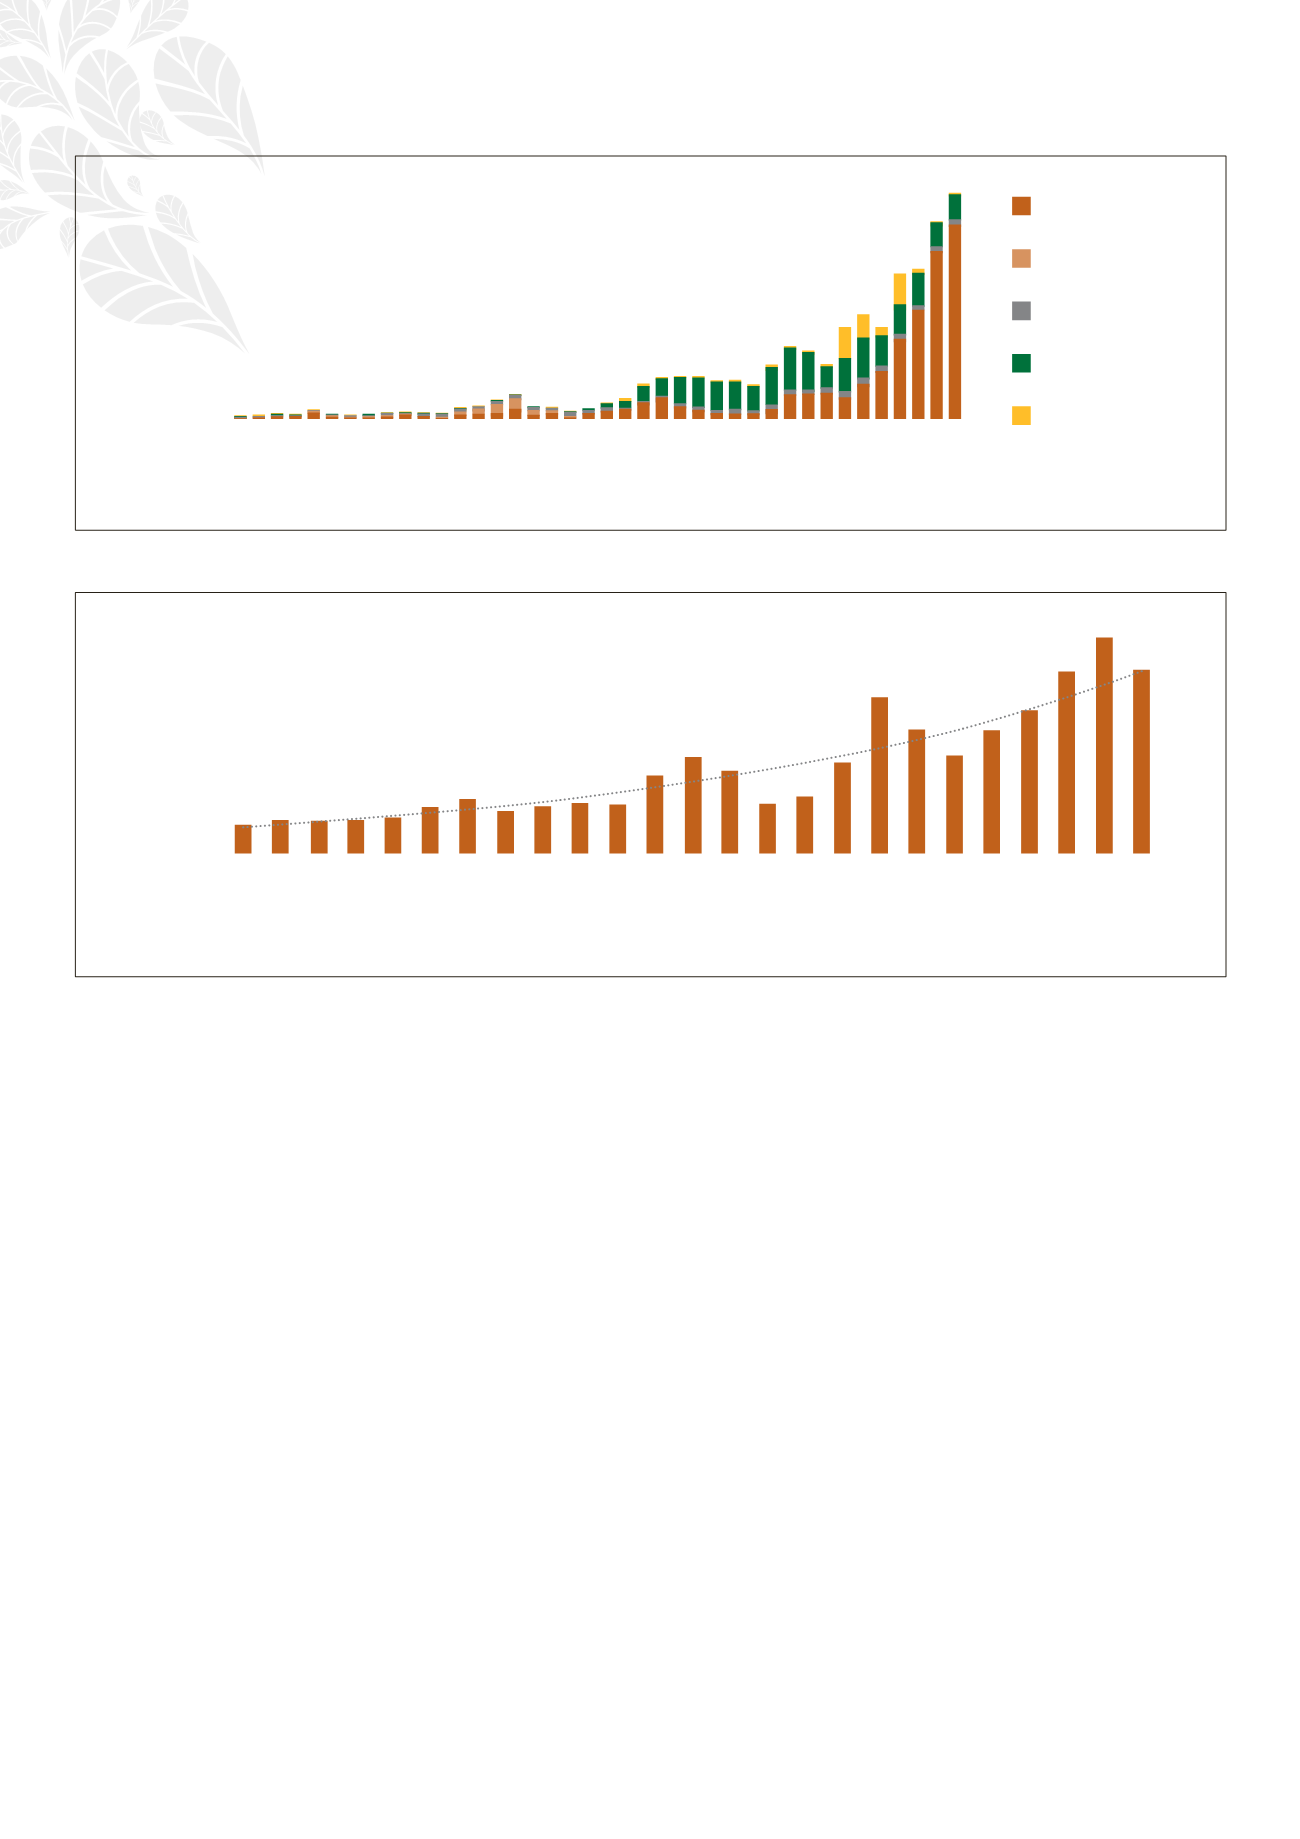
1 200 000
1 000 000
800 000
600 000
400 000
200 000
0
Tons
1976/1977
1978/1979
1980/1981
1982/1983
1984/1985
1986/1987
1988/1989
1990/1991
1992/1993
1994/1995
1996/1997
1998/1999
2000/2001
2002/2003
2004/2005
2006/2007
2008/2009
2010/2011
2012/2013
2014/2015
Oil and oilcake
Human consumption
Exports
Full fat
Seed and feed
Graph 30: Soybean production and consumption from 1976/1977 to 2014/2015
6 000
5 000
4 000
3 000
2 000
1 000
0
R/ton
1990/1991
1991/1992
1992/1993
1993/1994
1994/1995
1995/1996
1996/1997
1997/1998
1998/1999
1999/2000
2000/2001
2001/2002
2002/2003
2003/2004
2004/2005
2005/2006
2006/2007
2007/2008
2008/2009
2009/2010
2010/2011
2011/2012
2012/2013
2013/2014
2014/2015
Graph 31: Soybean prices from 1990/1991 to 2014/2015