


 83 / 124

81
September 2017
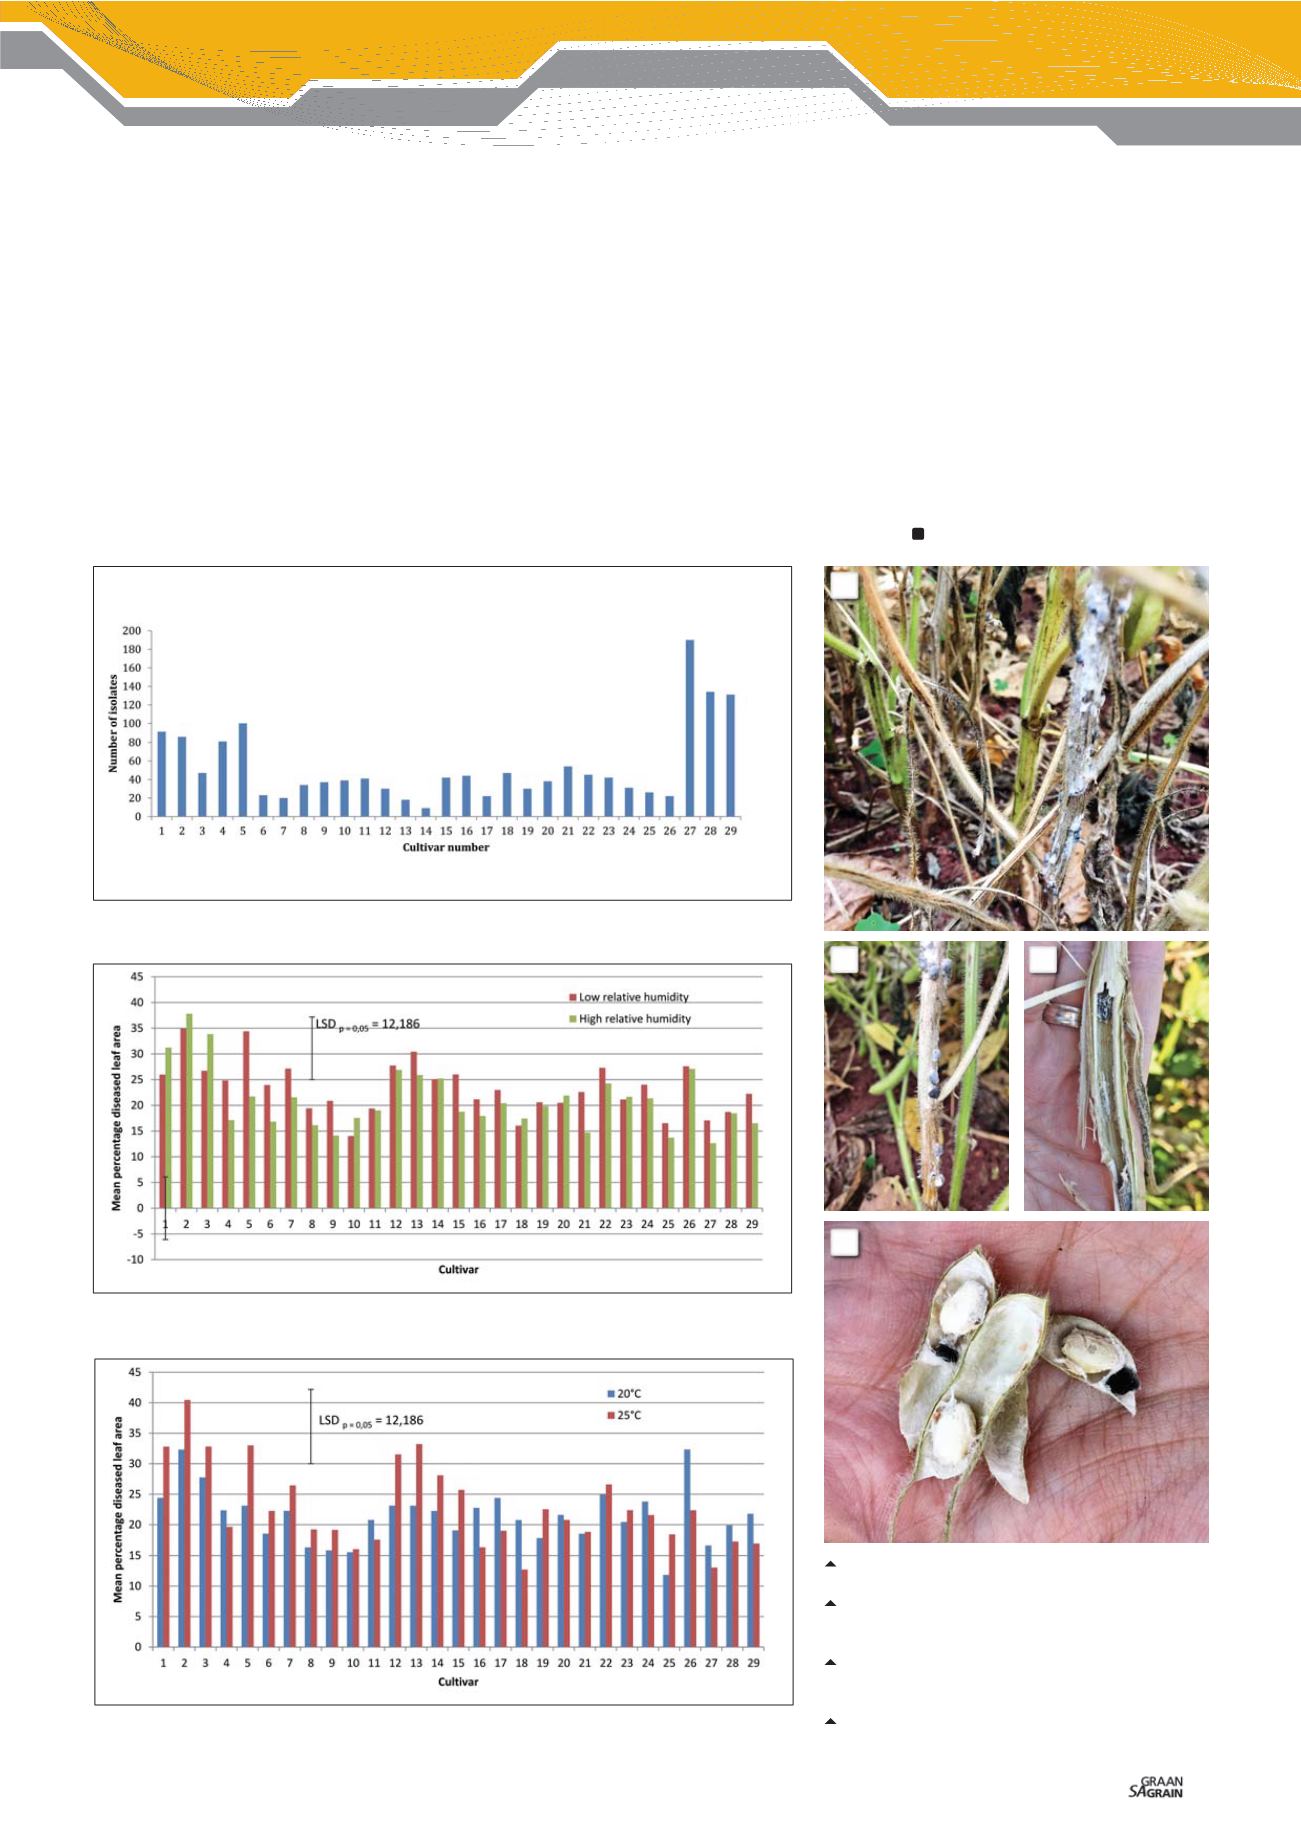
The detached leaf assay has been used ex-
tensively and it has been found to be one of
the best screening methods together with
the oxalic acid based method. Detached
leaf assays and an application calculating
percentage diseased leaf area were used
to screen the susceptibility of the 29 culti-
vars in Table 1 to
S. sclerotiorum
under dif-
ferent conditions of relative humidity and
temperature and the results can be seen in
Graph 2
and
Graph 3
.
Graph 2 indicates that cultivar LS 6444 R
was the most susceptible to
S. sclerotiorum
at both high and low relative humidity and
that cultivars DM 6.8i RR and PAN 1583 R
were the most tolerant under high and low
relative humidity, respectively.
Graph 3 indicates that NS 6448 R and
LS 6444 R were the most susceptible culti-
vars at 20°C and 25°C respectively. Cultivars
PAN 1614 R and LS 6466 R were the most
tolerant cultivars at 20°C and 25°C respec-
tively.
Overall, cultivars LS 6444 R, PAN 1454 R,
LS 6240 R, LS 6453 R and PAN 1500 R
were significantly more susceptible to
S. sclerotiorum
compared to other cultivars.
Considering the results, it is evident that
certain cultivars should be selected by
growers based on their ability to perform
well under specific environmental condi-
tions, and because of their seed quality.
If a grower experienced a Sclerotinia stem
rot outbreak in previous years, it could be
beneficial to select cultivars that are more
tolerant to the pathogen while avoiding
more susceptible cultivars, in order to man-
age a possible future outbreak.
Further research needs to be conducted
in order to effectively manage the disease
using cultivar selection, biological control
agents, as well as integrated pest manage-
ment.
Graph 1: Bar graph showing the number of fungal isolates obtained per cultivar during seed
health testing of certified seed.
Graph 2: Bar graph presenting the mean percentage diseased leaf area for each cultivar at
high and low relative humidity.
Graph 3: Bar graph presenting the mean percentage diseased leaf area for each cultivar at
two different temperatures.
1: Stem rot lesions on a soybean stem.
Photo: Liezl van der Hoven
2:
Sclerotinia sclerotiorum
sclerotia and white
mycelium or mould present on infected tissue.
Photo: Liezl van der Hoven
3: Sclerotia present inside a stem showing re-
placement of vascular tissue.
Photo: Liezl
van der Hoven
4: Sclerotia inside soybean pods.
Photo: Liezl van der Hoven
1
2
4
3