


 99 / 116

97
March 2017
which is correlated to positive changes in
soil health parameters due to the effect of
plant roots, such as soil porosity, root chan-
nels, soil organic matter and improved soil
structure.
Improvements in these parameters will
help to increase water infiltration and root
growth in a soil that is typically not tilled
under CA conditions. Finally, higher crop
densities can improve the distribution and
amount of crop residues after harvesting,
which will have a further significant impact
on soil health and yield over the longer term.
Crop density trials were planted by the
producers to ascertain whether cultivation
practices (tillage, strip-till and no-till) may
lead to different crop density recommen-
dations. There were quite a few factors and
practices that differed between the pro-
ducer-managed trials, but it is envisaged
that the important reactions and influences
of various treatments, such as plant popula-
tion and row width, will become clear over
time.
This study also includes results from an on-
farm trial where maize was planted directly
after winter cover crops. Some results of
soybean trials will also be presented here.
Maize plant density trials
Yields for the different plant density trials
are shown in
Graph 1
. It was a very difficult
year due to early season droughts which
caused a lot of the variability that was ob-
served. Rainfall normalised during the latter
half of the season.
Although Graph 1c to Graph 1f show mean
yields of more than 7 t/ha for no-till maize as
compared to less than 6 t/ha for convention-
al and strip-tilled plots (Graph 1a and 1b), it
will be premature to come to final conclu-
sions regarding cultivation practices after
only one year’s data.
There is not much to be said about the ef-
fect of row widths at this stage (Graph 1e
and Graph 1f). Graph 1e and 1f show yields
of two trials that were planted next to each
other and analysis of variance showed that
the effect of row width was not significant.
Differences due to varying plant popula-
tions were generally not as large as one
would have expected and the trends were
not clear. This was due to the ability of the
crops to compensate for different plant
populations. Results are not shown, but it
was found that head number per plant that
increased with lower plant populations was
a prominent way of compensating for plant
population differences.
Graph 1c (farm with the longest no-till his-
tory) tends to suggest persistent yield in-
creases up to the highest plant population.
Long-term monitoring will clarify this obser-
vation.
Maize planted after winter
cover crops
Photo 1
shows how some strips of winter
cover crops looked just before they were
killed by herbicide application in October
2015.
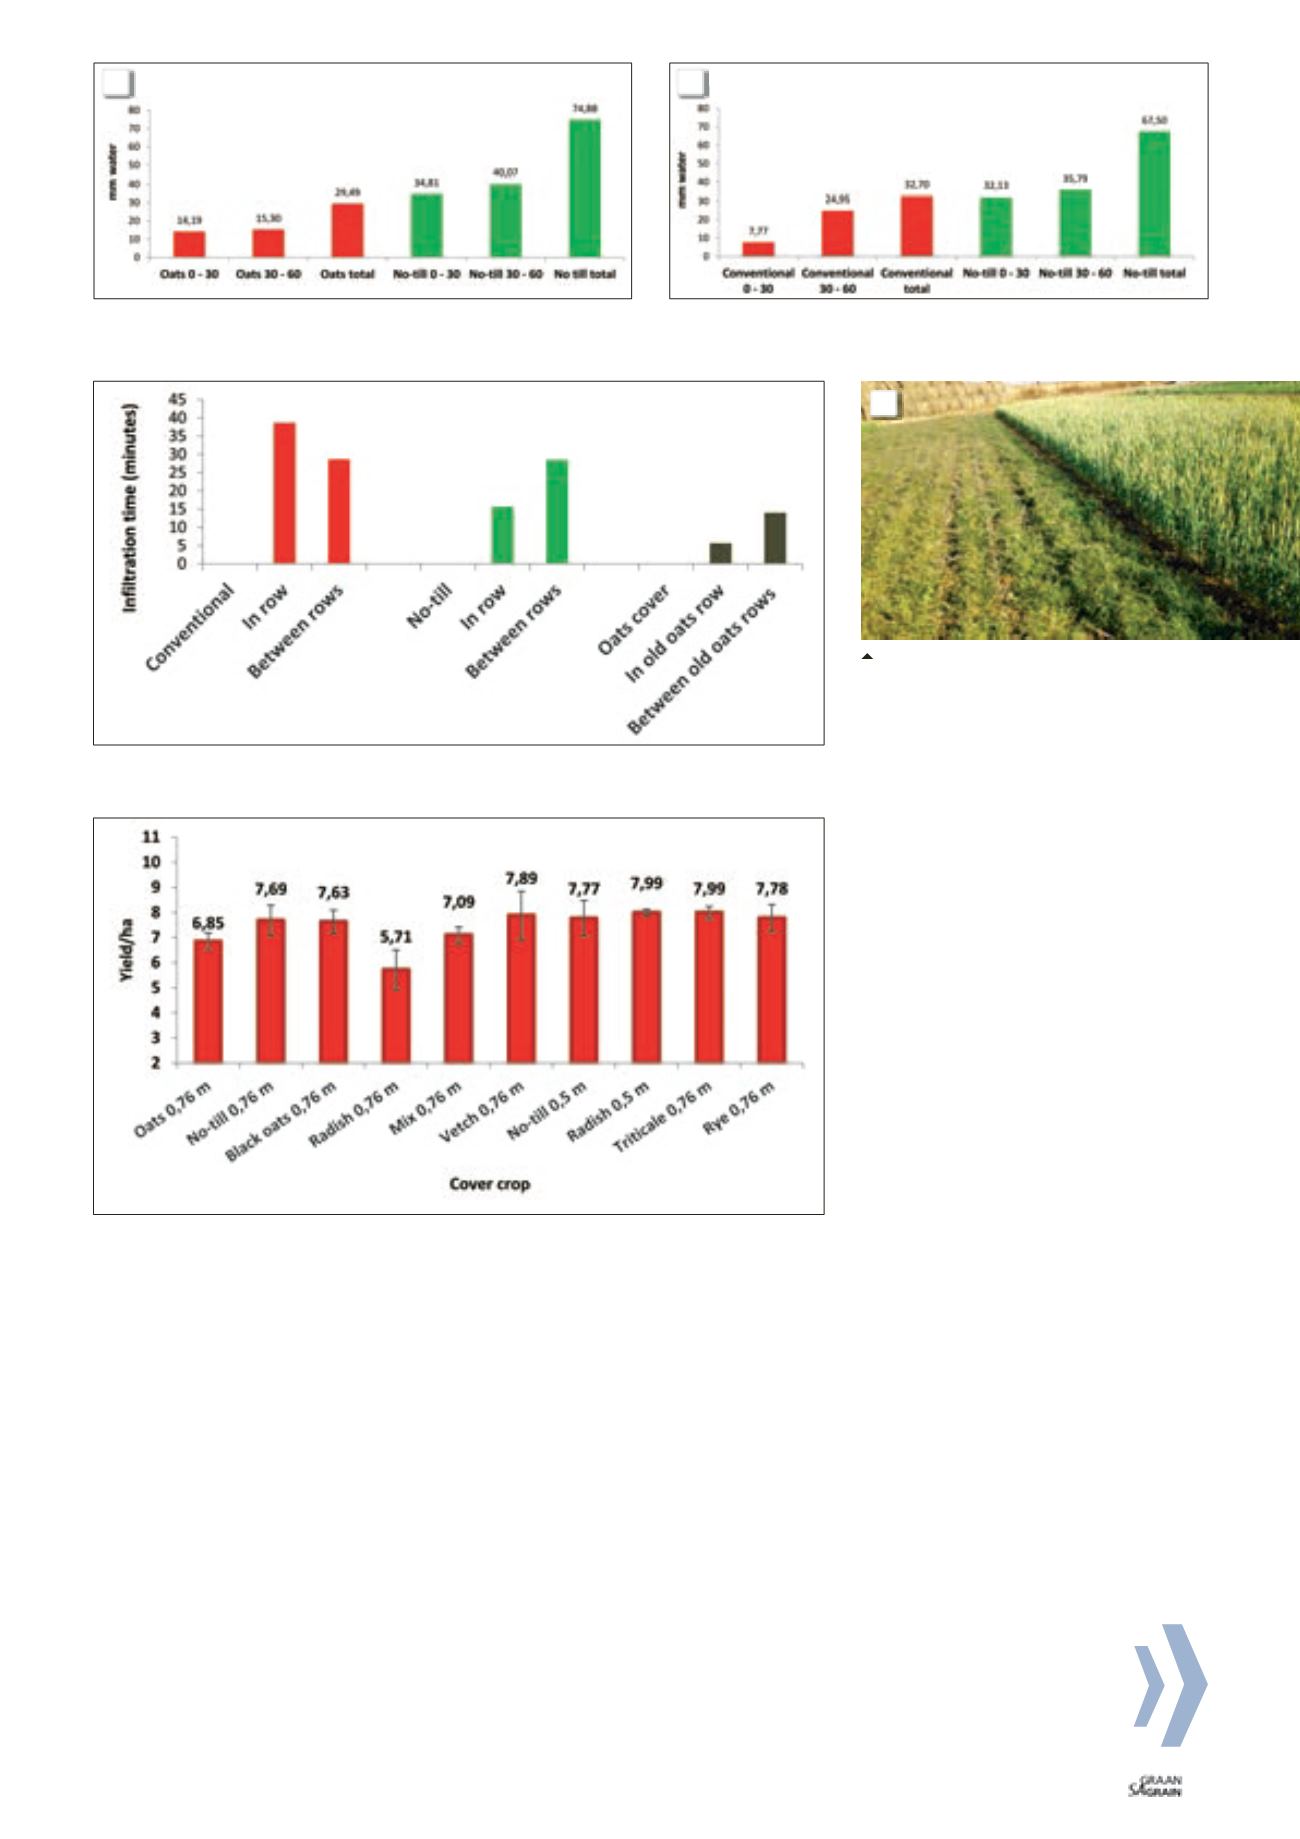
Graph 2a
shows drier soils just before
the summer planting season commenced
when a winter cover crop was planted.
Cover crop depletion of soil water was,
however, not worse than evaporative water
loss from a neighbour’s bare soil that was
conventionally tilled (
Graph 2b
).
Graph 2a - 2b: Comparison of water content for two soil layers on 14 October 2015 between Graph 2a
winter cover crop and no-till control and between Graph 2b conventional and no-till plot.
1: Winter cover crop strip plots with vetch in
the foreground followed by wheat (right) and
then radish, oats (white and black), triticale
and rye.
Graph 3: Soil water infiltration rates measured in December 2015 to demonstrate differences be-
tween no-till, conventional tillage and no-till with a winter cover crop.
Graph 4: Maize yields for different winter cover crop and row width treatment combinations.
1
2a
2b