


 100 / 116

Maart 2017
98
ON FARM LEVEL
Conservation agriculture
Water infiltration rates were determined
and showed that infiltration rates were
much better on soil that had been planted
under a cover crop (
Graph 3
).
The next best rate was the no-till control
treatment which was covered by stubble.
Conventionally tilled soil had the lowest in-
filtration rate. A good infiltration rate might
have been especially important during this
particular dry year to increase rainfall effec-
tivity.
Photo 2
shows how the cover cop treat-
ment lagged the control in terms of devel-
opment (height) and more water stress
symptoms can be seen in this treatment.
The cover crop treatment remained be-
hind and flowered one and a half weeks
later than the control. The rainfall pattern
returned to normal after flowering and grain
filling progressed unhindered afterwards.
Graph 4
shows no significant maize yield
differences between the cover crop treat-
ments and the no-till control except for the
low yield of the radish treatment in 0,5 m
rows. One of this treatment’s replicates
was an outlier that resulted in the low mean
yield. The other radish treatment in 0,76 m
rows doesn’t show that radish decreases
yields.
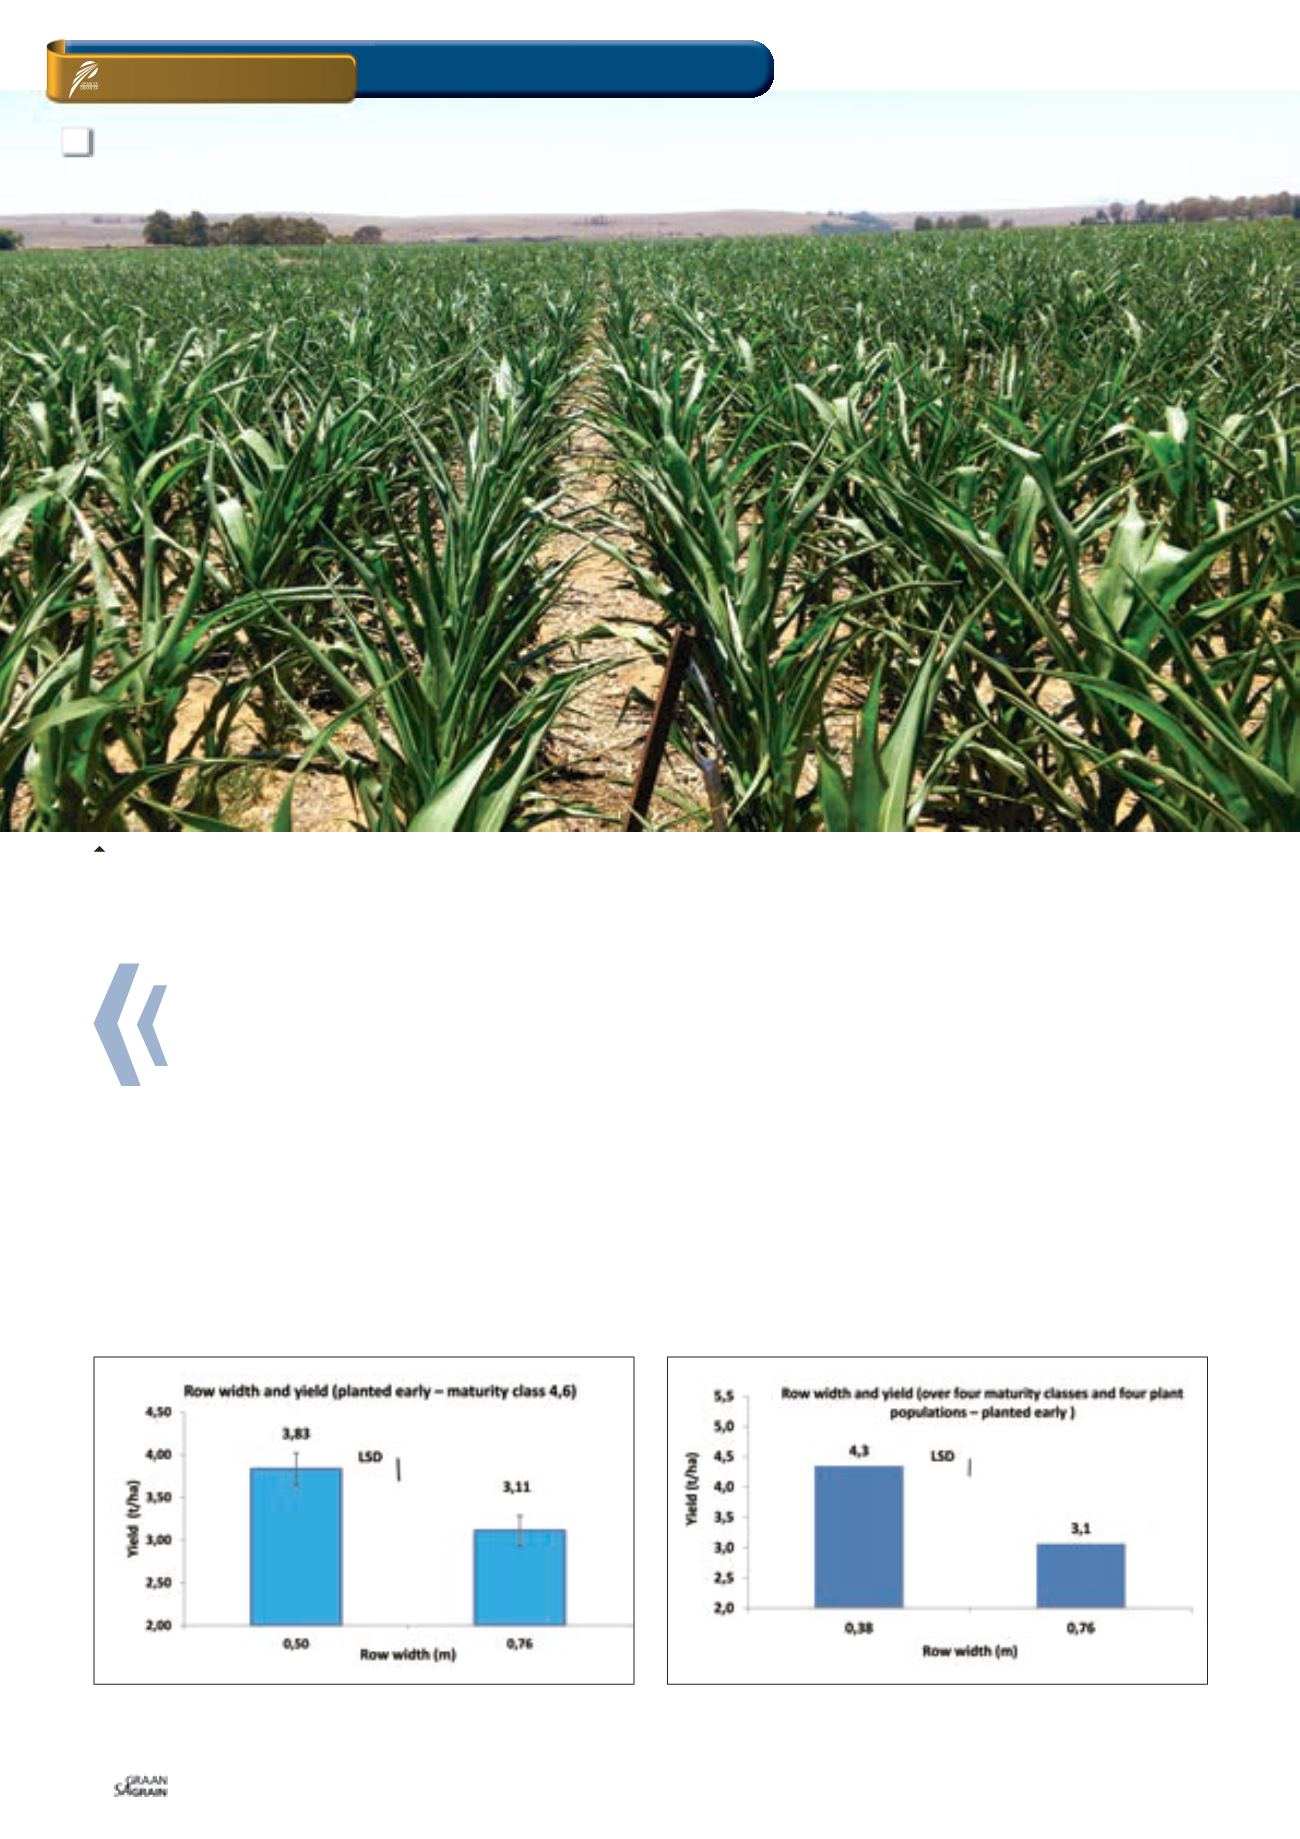
Soybean yield and row
width
The year under consideration (initially dry)
favoured narrow rows in terms of soy-
bean yield as illustrated by
Graph 5
and
Graph 6
. Yields for an early maturing culti-
var increased from 3,11 t/ha in 0,76 m rows
to 3,83 t/ha in 0,5 m rows (Graph 5).
The comparable increase in a factorial
experiment with four cultivars was from
3,1 t/ha to 4,3 t/ha (Graph 6).
2a and 2b: No-till control plot (Photo 2a) with the cover crop treatment (Photo 2b) showing more stress symptoms.
Graph 5: Effect of row width on soybean yield of one cultivar under
no-till conditions.
Graph 6: Main effect of row width on soybean yield under no-till
conditions in a factorial experiment with four cultivars and four plant
populations.
CA RESEARCH
in north eastern Free State
2a