


 117 / 132

115
September 2018
relevant
We are grateful to the Maize Trust for financial support of these annual surveys and to the members of Agbiz Grain
for providing the maize crop samples.
Maize quality 2016/2017
Grit Yield All is linearly correlated with the
SAGL MI and indicates the true amount of
total hard endosperm that can be extract-
ed from the maize during Roff milling. The
NIT calibration value for Grit Yield All pro-
vides this estimate directly from the whole
maize without need for further milling tests.
Grit Yield All is also reported on a 14%mois-
ture base.
The 2016/2017 season maize samples were
measured with the NIT on the SAGL Milling
Index 2017 model. The Milling Index varied
from an average of 80,2 for white maize
to 76,8 for yellow maize. Grit Yield All val-
ues averaged 64,8 for white maize and 64
for yellow maize.
Roff milling and
whiteness index
The average percentage extraction of total
meal in white maize obtained with the Roff
mill averaged 78,6% (0,2% higher than the
previous season) and varied from 69,7%
to 81,7%.
For unsifted and sifted maize meal the
whiteness index averaged 25,4 and 17,4
respectively. Sieving the sample elimi-
nates differences in the readings as a result
of particle size. The whiteness index of
the previous season averaged 26,1 and
17,5 for unsifted and sifted maize meal
respectively.
The higher the whiteness index (WI) value
obtained, the whiter the meal sample. The
sample with the lowest sifted whiteness
index value of -17,5 this season, also had
the highest percentage other colour maize
namely 7%.
Nutritional values
The average fat content of white maize
was 0,1% higher than the 4,1% of both
the previous season as well as the aver-
age fat content of yellow maize this season.
The protein content of yellow maize aver-
aged 8,9%, which was 0,2% higher than
that of white maize. The protein content of
yellow maize was on average 0,8% lower
than in the previous season and that of
white maize 1% lower than in the 2015/2016
season. The protein contents, however,
compare very well with the ten-year
averages.
Starch content of white maize (74,1%)
was on average 1,5% higher than in the
previous season and yellow maize (73,7%)
1,4% higher. Both are also higher than the
ten-year averages. The fat, starch and pro-
tein nutritional components are reported
as percentage (g/100 g) on a dry base.
Visit our website (
www.sagl.co.za
) for de-
tailed results of this, as well as previous
surveys. The reports are also available for
download in a PDF format.
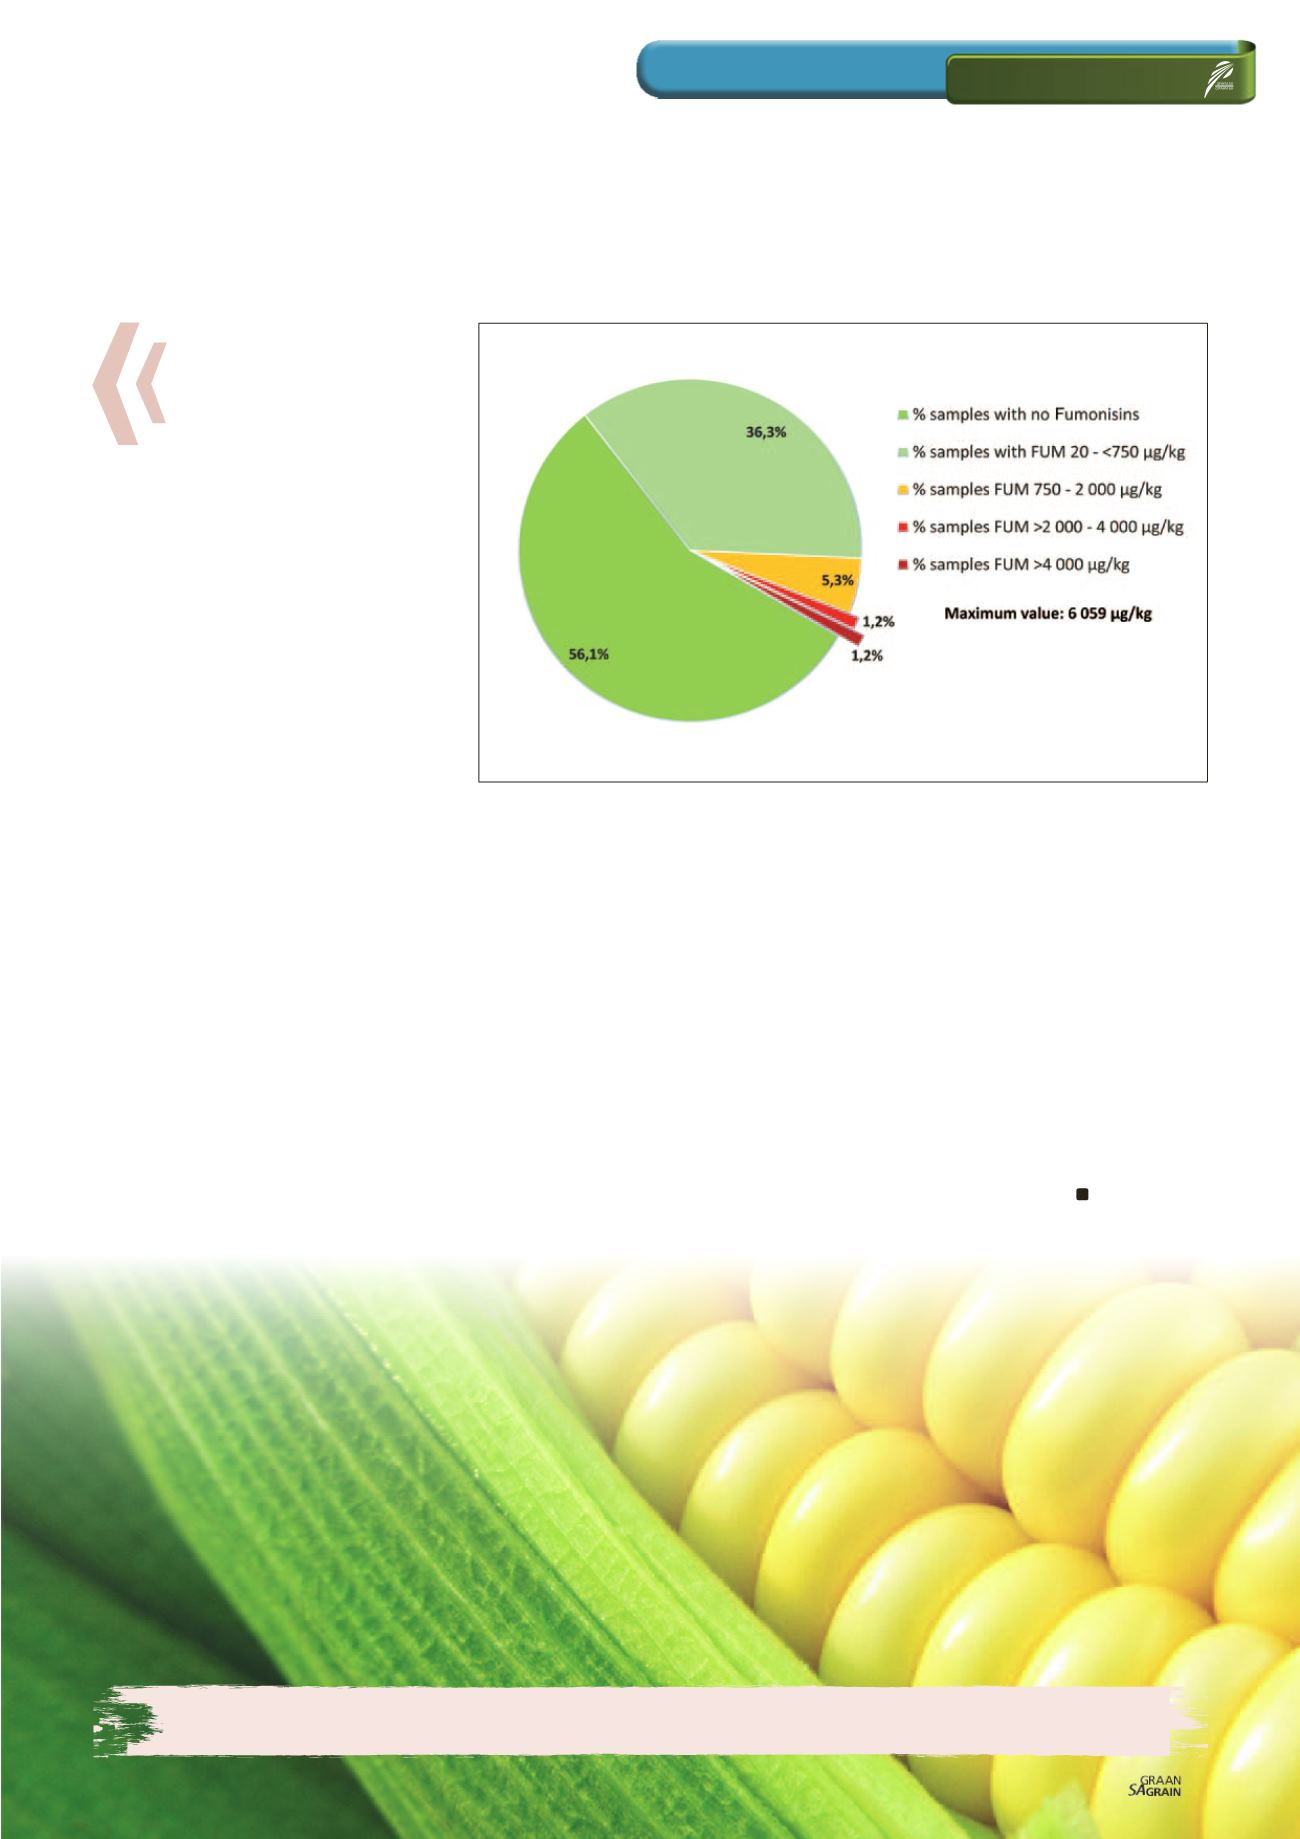
Graph 6: Fumonisin occurrence in the 2016/2017 yellow maize crop.