


 115 / 132

113
September 2018
relevant
Maize quality 2016/2017
The 100 kernel mass (‘as is’ basis) of white
maize (35 g) averaged higher than yellow
maize (33,5 g). This trend was also obser
ved in previous seasons. The percentage
yellow maize kernels above the 10 mm
sieve were on average 10,7% lower than
white kernels and the percentage yellow
kernels below the 8 mm sieve 9,3% higher
than that of white maize. White maize ker-
nels were larger than in the previous two
seasons, while the yellow maize kernels
were still some of the smallest over the past
ten seasons.
Both white and yellow maize were slightly
more susceptible to breakage than during
the previous season. The percentage stress
cracks observed varied overall from 0%
to 50%, and averaged 8% for both white
and yellow maize – 3% higher than in the
previous season.
Milling Index
Milling Index is an indication of the milling
abilities and milling quality of maize kernels,
where a higher Milling Index means a high-
er extraction of the high-grade and most
profitable products like samp, maize rice
and maize grits (degermed products) that
are manufactured from the corneous part
of the endosperm.
The Milling Index is a model developed
on the Foss NIT Infratec 1241- Generation
3 Standard Version Grain Analyser where
the NIT spectra were modelled against the
Roff milling fractions. In the previous sea-
sons (until 2015/2016) the Milling Index of
the samples were determined with the cali-
bration model developed by the ARC-Grain
Crops. With this model, the average Milling
Index of a sample with good milling charac-
teristics is about 95 with a variation of about
55 (low milling quality) to about 115 (very
good milling quality).
The SAGL was tasked by the Maize Trust
to develop a new model for Milling Index
using samples from maize cultivar trials
supplied by the ARC-Grain Crops and by
commercial seed breeders over four sea-
sons (from 2012/2013 onward). The trials
included a range of hardness levels. The
New Milling Index (NMI) that was devel-
oped is similar to the original ARC formula
but on a 14% moisture basis, and with the
constants removed. The NMI model has
improved precision compared to the older
version, due to the almost tenfold increase
in the number of samples used to build
the calibration model.
During the fifth year, samples of commer-
cial hybrids, selected imported maize sam-
ples and outlier samples from the 2014/2015
and 2015/2016 seasons were included to
develop a robust model with the assistance
of FOSS to produce accurate results. The
improved new model, SAGL Milling Index
2017, now includes two parameters, SAGL
Milling Index (SAGL MI) as well as a new
parameter namely Grit Yield All (GYA).
SAGL Milling Index indicates the relative
ratio of total hard endosperm products
(B2 grits, B3 fine grits and B3 coarse grits)
to offal products (B1 fine flour and total
chop/bran) as determined on a Roff mill
and used for calibration of the NIT. It is ex-
pressed as a dimensionless index value
according to the scale in
Table 1
.
Grit Yield All is defined as the sum of the
mass fractions of the Roff B2 grits, B3
fine grits and B3 coarse grits fractions ex-
pressed as a mass percentage of the total
mass of the whole maize before milling.
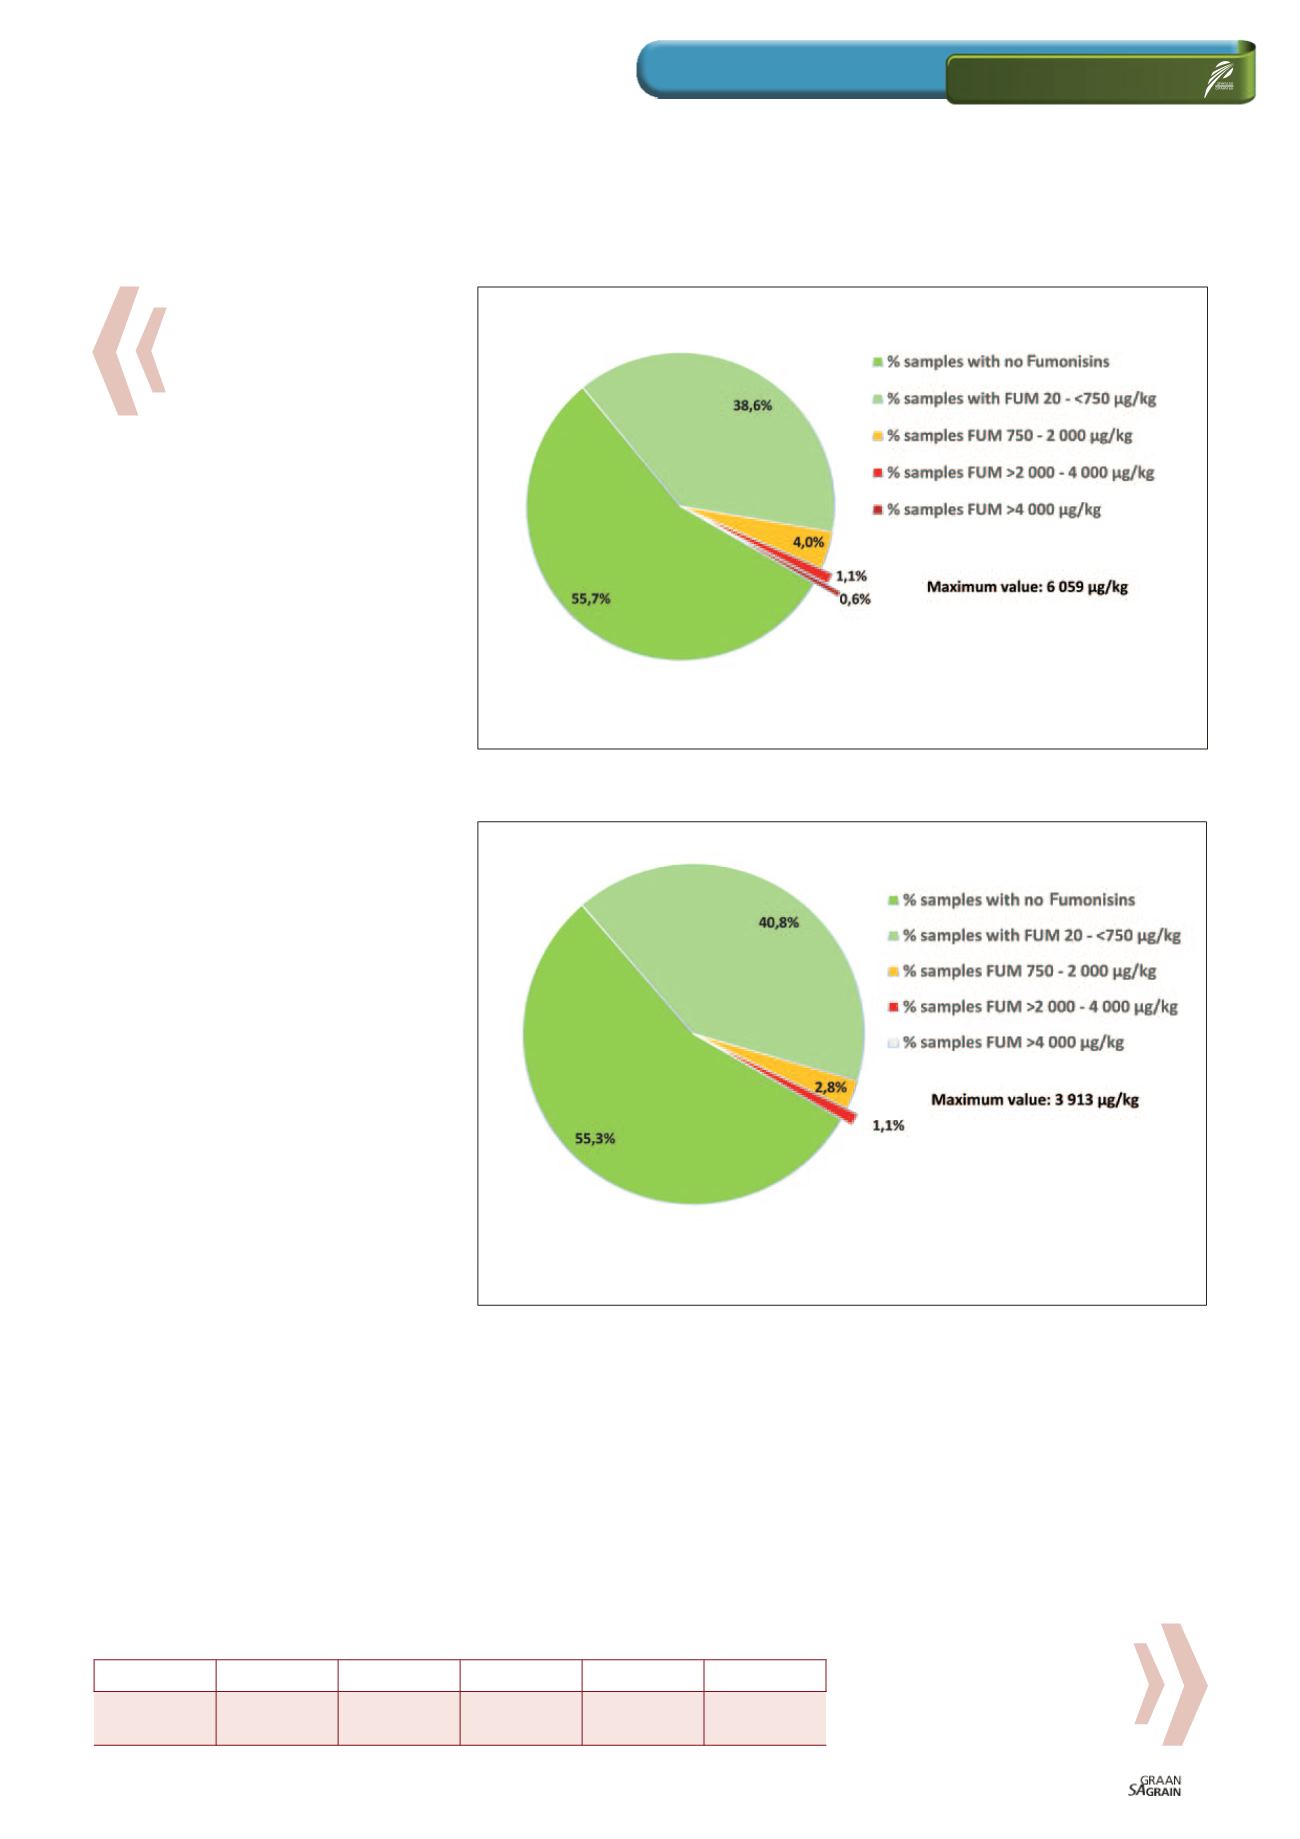
Graph 4: Fumonisin occurrence in the 2016/2017 maize crop.
Graph 5: Fumonisin occurrence in the 2016/2017 white maize crop.
SAGL MI
<40
40 - 60
60 - 80
80 - 100
>100
Description
Soft
Medium Moderately
hard
Hard
Very hard
Table 1: The dimensionless index value.