


 63 / 84

sunϐlower crop in the spotlight
T
he 2016/2017 sunflower crop qua-
lity survey is the fifth annual sur-
vey performed by the Southern
African Grain Laboratory (SAGL).
The goal of this survey is to compile a de-
tailed database, by accumulating quality
data collected on the national commercial
sunflower crop over several seasons.
This essential database can assist the
industry in decision making processes. The
data reveal general tendencies and highlight
quality differences in the commercial sun-
flower produced in different local produc-
tion regions.
Quality analyses, which included grading,
were performed on 176 composite samples.
These composite samples, representing
each delivery of sunflower seed at the
various silos throughout the sunflower pro-
duction regions, were taken according to
the prescribed grading regulations, during
the 2017 harvesting season.
Grading was done in accordance with the
regulations relating to the grading, packing
and marking of sunflower seed intended for
sale in South Africa (No. R 45 of 22 January
2016). 85% (150) of the samples were
graded as Grade FH1, with 26 of the samples
downgraded to class other sunflower seed
(COSF). The percentage of FH1 samples
increased compared to the 78% of the
previous season and is similar to the 86%
of the 2014/2015 season. The majority (17)
of the samples was downgraded as a result
of the percentage of either the screenings or
the collective deviations or a combination of
both, exceeding the maximum permissible
deviations of 4% and 6% respectively. Other
deviations resulting in the downgrading
of samples were the percentage damaged
sunflower seed, the percentage foreign
matter, the percentage sclerotia as well as
the presence of an undesired odour in the
samples.
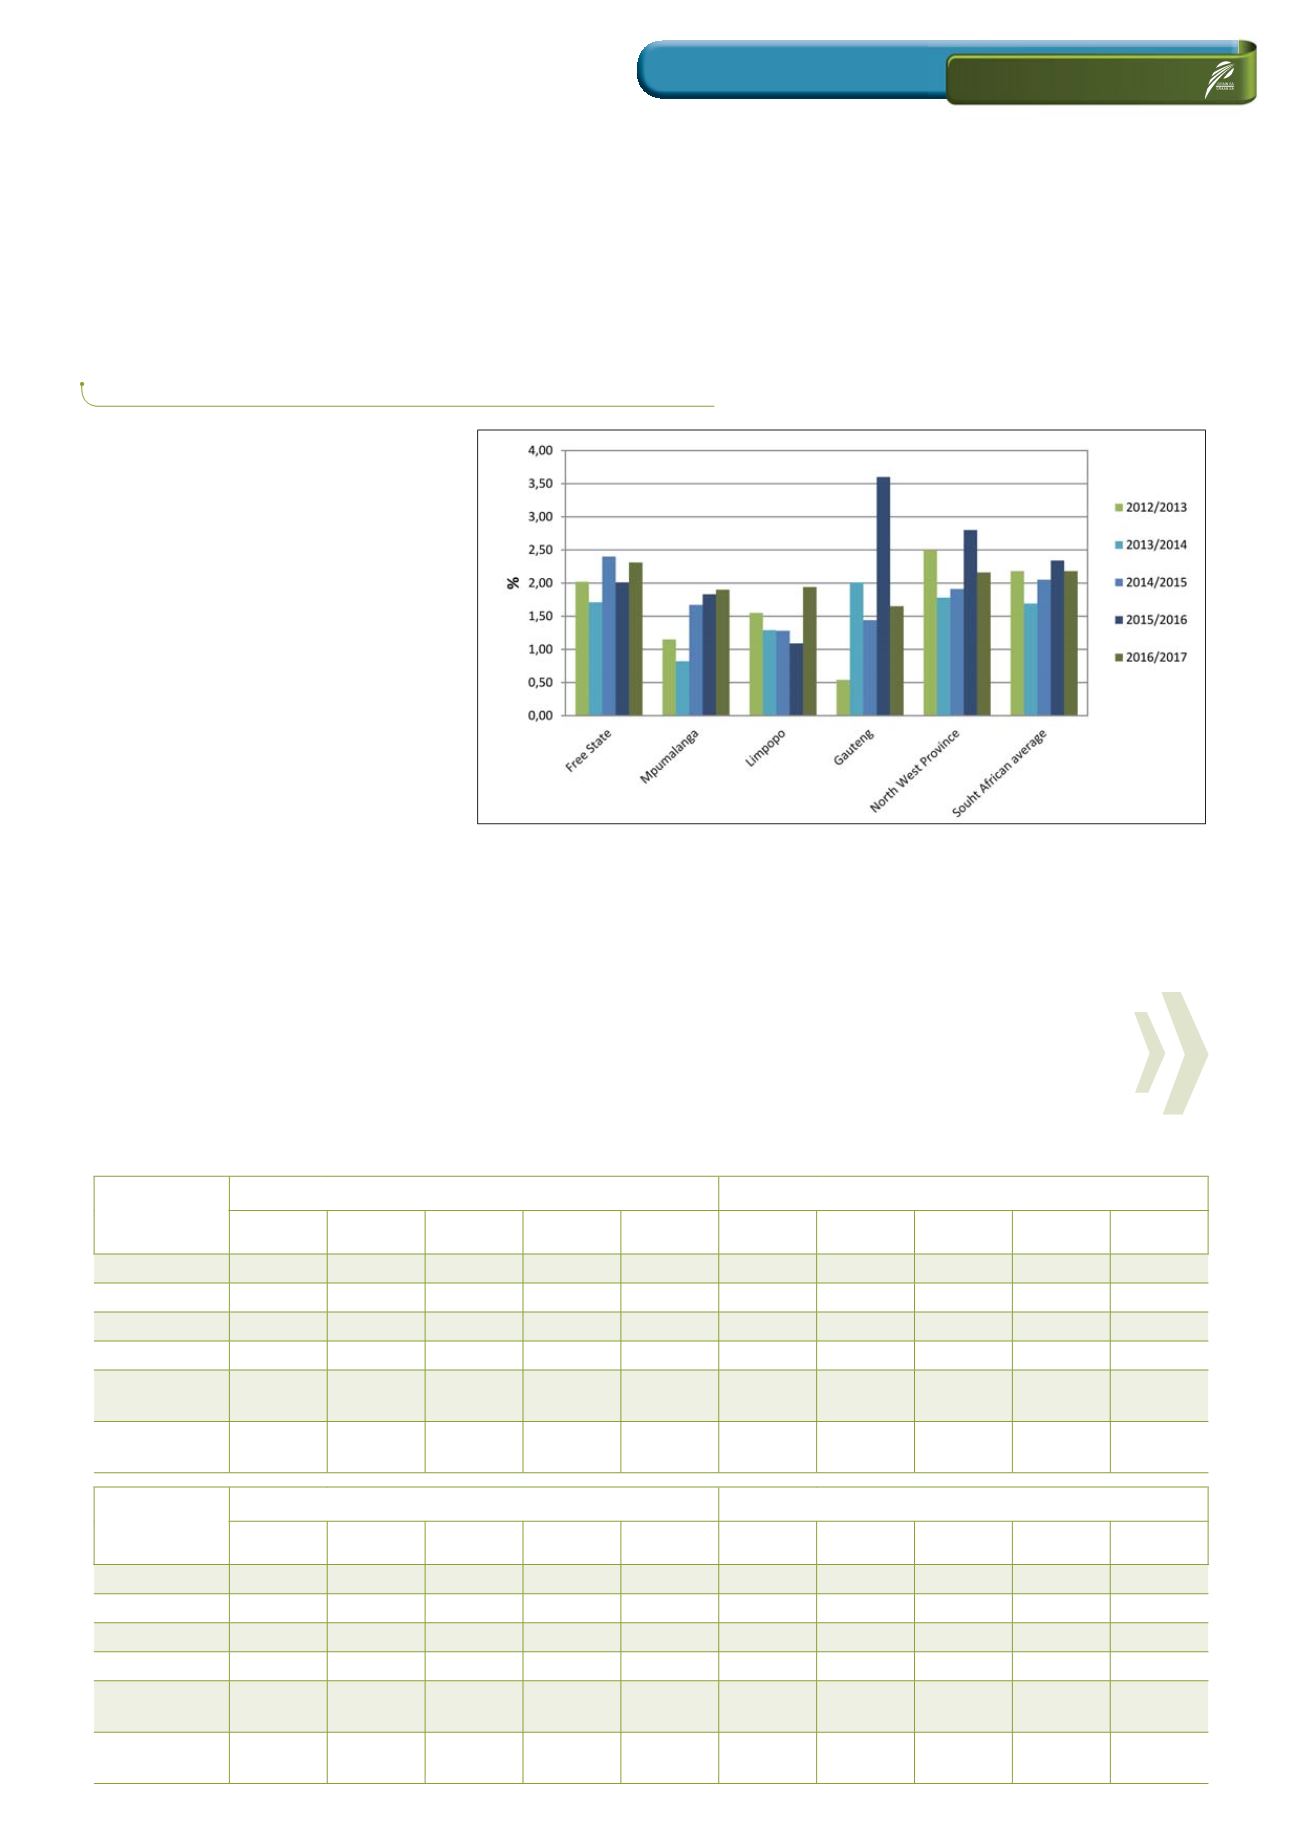
Refer to
Graph 1
and
Graph 2
(on page 63)
for the weighted average percentage
screenings and foreign matter per province
over five seasons.
61
May 2018
RELEVANT
JOLANDA NORTJÉ,
manager: Laboratory, Southern African Grain Laboratory NPC
Graph 1: Average percentage screenings per province over five seasons.
PROVINCE
CRUDE PROTEIN CONTENT, %
CRUDE FAT CONTENT, %
2012/2013 2013/2014 2014/2015 2015/2016 2016/2017 2012/2013 2013/2014 2014/2015 2015/2016 2016/2017
Free State
16,22
15,95
16,27
17,77
16,78
39,9
39,7
40,4
38,0
38,5
Mpumalanga
15,24
15,07
16,47
17,14
15,43
40,5
42,4
39,3
38,8
40,2
Limpopo
17,58
16,95
17,44
17,16
17,15
38,2
40,7
38,8
40,0
39,7
Gauteng
16,23
15,44
16,55
17,69
17,37
41,1
42,5
41,4
40,3
38,7
North West
Province
17,21
16,49
17,53
18,24
16,53
38,7
38,8
39,2
38,2
38,4
South African
average
16,77
16,15
16,95
17,93
16,63
39,2
39,6
39,7
38,2
38,6
PROVINCE
CRUDE FIBRE CONTENT, %
ASH CONTENT, %
2012/2013 2013/2014 2014/2015 2015/2016 2016/2017 2012/2013 2013/2014 2014/2015 2015/2016 2016/2017
Free State
20,3
20,2
19,9
20,5
20,5
2,58
2,69
2,58
2,64
2,67
Mpumalanga
20,7
18,7
20,7
20,9
21,2
2,43
2,58
2,45
2,49
2,29
Limpopo
19,9
18,6
19,3
20,4
19,7
2,60
2,59
2,56
2,69
2,67
Gauteng
18,9
19,2
19,1
19,2
19,4
2,34
2,53
2,45
2,67
2,37
North West
Province
19,7
20,6
20,1
20,2
21,6
2,51
2,65
2,54
2,55
2,39
South African
average
20,0
20,2
20,0
20,3
21,0
2,54
2,66
2,55
2,59
2,52
TABLE 1: WEIGHTED AVERAGE RESULTS ON AN ‘AS IS’ BASIS PER SEASON.