
Product information
Julie 2017
24
Cover crops and crop nutrition
C
over crops are extensively used in conservation agriculture
systems – not only for the physical ameliorations such as
erosion control, increased water infiltration, reduced com-
paction, increased aggregate stability and building organic
matter, but also for their ability to improve the nutrient status of
the soil. Leguminous cover crops, such as sunn hemp, have the
ability to fix atmospheric nitrogen through the symbiotic relation-
ships which exist with certain Rhizobium species of soil bacteria and
thus add nitrogen to a soil. The non-leguminous cover crops, such
as saia oats, act as trap crops for residual nutrients which may
have otherwise been lost through leaching.
When considering plant available soil nutrients, they generally oc-
cur in two forms: As inorganic compounds and elements which are
dissolved in water and are attached to minerals in the soil and as
organic or carbon compounds, which include living organisms and
dead organic matter.
The soil microbes, consisting in part of bacteria, fungi, proto-
zoa, nematodes and micro-arthropods are the mechanisms which
transport the nutrients between the inorganic and organic forms. It
is logical to conclude that the more food there is for them in the
soil, in the form of organic matter, the more nutrients can be re-
cycled through the micro-organisms of the soil food web, hence in-
creasing the fertility.
Cover crops provide the food for these
microscopic soil workers
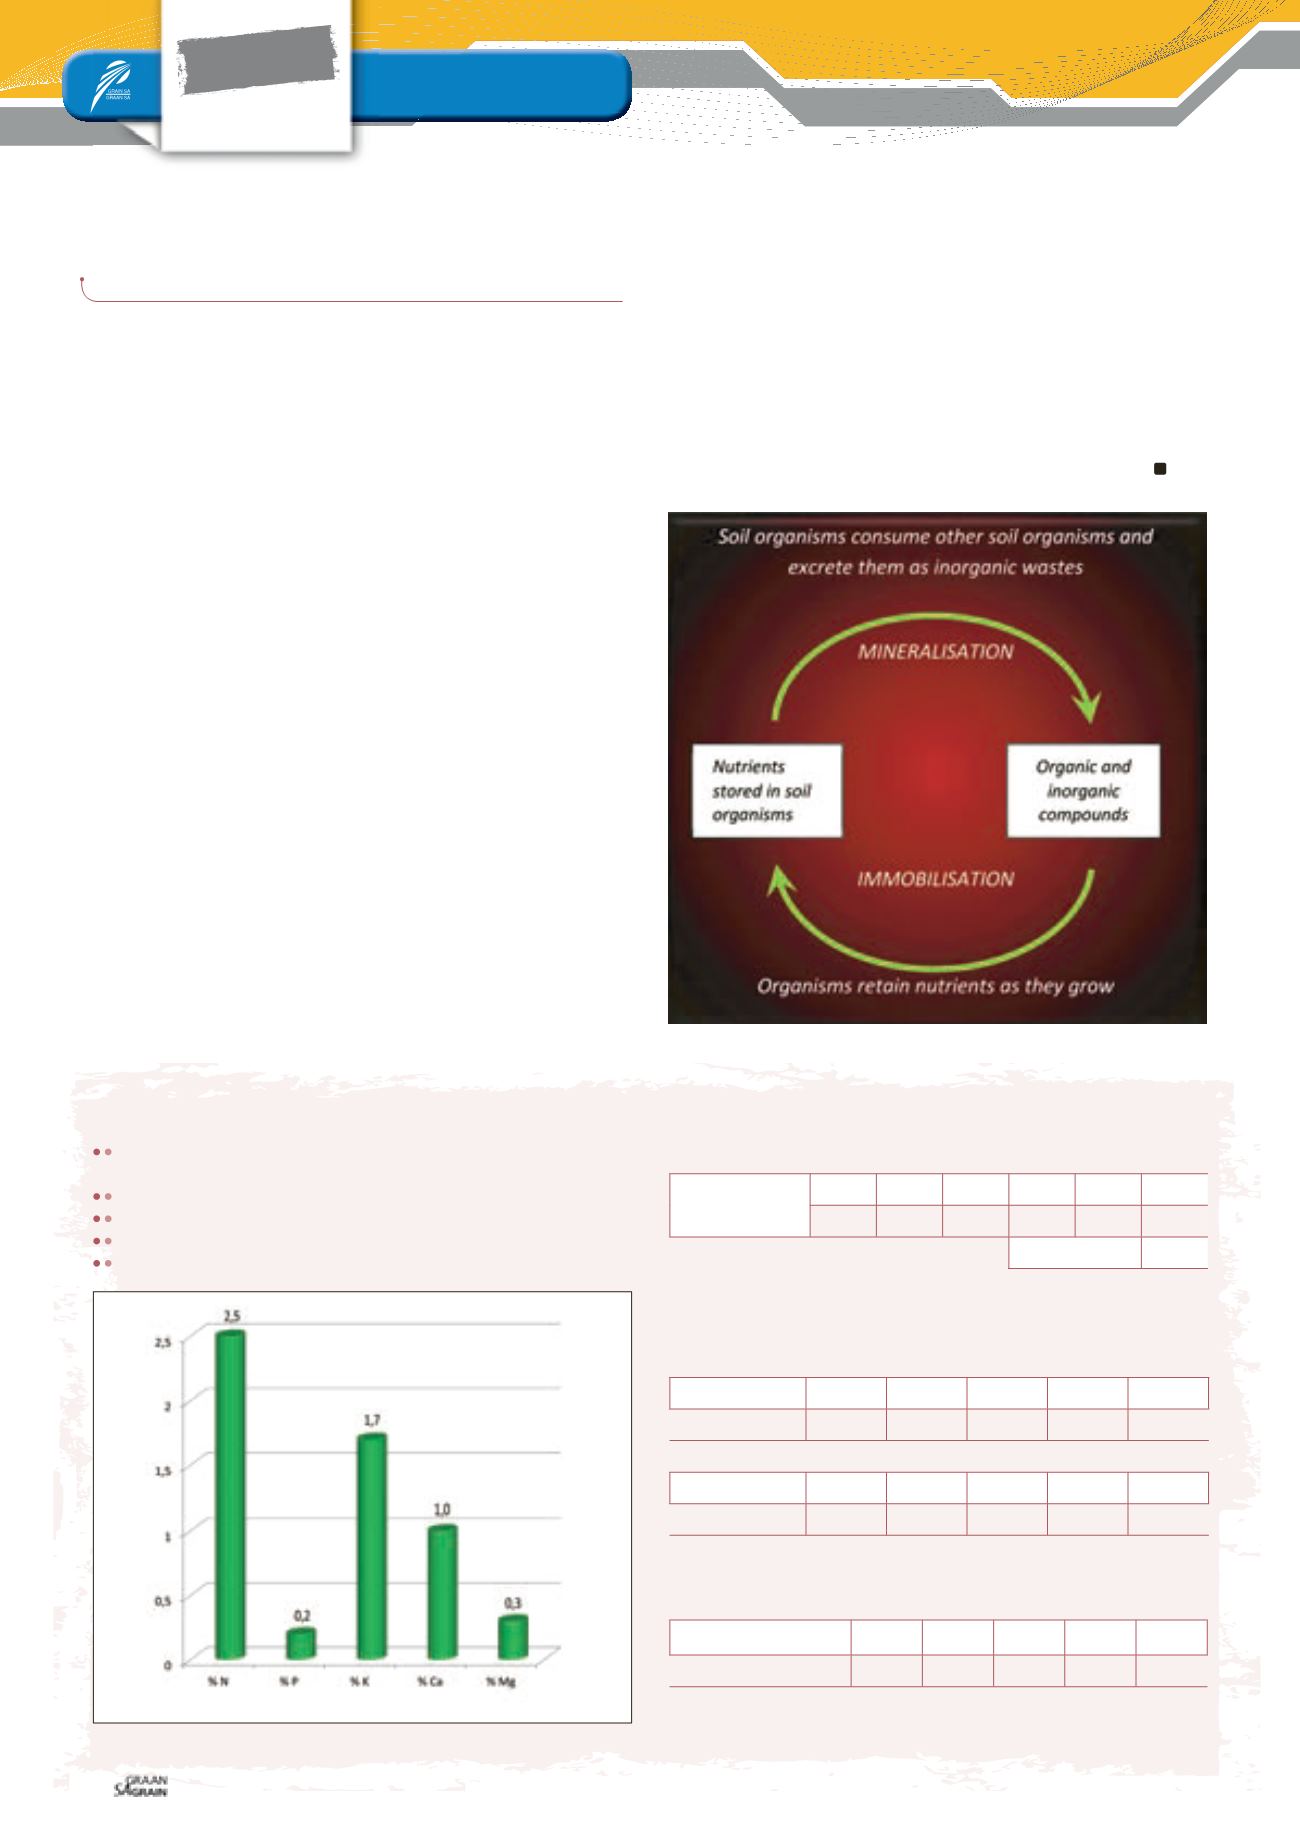
The nutrients are immobilised when they are ‘eaten’ by the soil mi-
crobes and mineralised when they are digested and excreted by
the soil organisms (
Figure 1
). The mineralised nutrients are in a plant
available form and can be taken up and utilised by plants.
While all plants contain nitrogen, phosphate and potassium, the
relative proportions of these elements vary in different plants. Know-
ing these percentages allows us to roughly estimate what nutrients
are being recycled and made available following a cover crop.
These proportions are affected by the age of the plants and to some
extent by the conditions under which they have been grown.
FOCUS
Fertiliser
Special
SIMON HODGSON,
general manager: Cover Crops, AGT Foods Africa
CROP
N
P
K
CA MG
Sunn hemp
2,5% 0,2% 1,7% 1,0% 0,3%
9 296 kg dry matter per hectare
KG PER HA
N
P
K
CA MG
Sunn hemp
232
19
158
93
28
Due to the fact that the soil microbes digest and use two thirds of the available
nutrients for themselves, it means that only one third (33,3%) of the nutrients fixed
are available to the plants
SAMPLES
3,5 3,1 3,1 3,0 3,0 15,7
3,4 3,5 3,4 3,2 4,0 17,5
Total
33,2
Average: 3,2 kg per m² x 10 000
= 33 200 kg of wet matter per hectare
Dry matter = 28% of wet matter
= 9 296 kg dry matter per hectare
KGS OF NUTRIENT N P
K CA MG
Available
77
6
52
31
9
These nutrients are available on a slow release basis. The microbes take time to
decompose the cover crop and the nutrients are released over this period, unlike
fertiliser from a bag
Graph 1: Nutrient availability from an average sunn hemp cover crop.
Figure 1: Cover crops provide the food for these microscopic soil workers.
Cut and weigh ten samples of area 1 m x 1 m randomly selected
from the field.
Take an average weight per m².
Multiply by 10 000 to get wet matter weight per hectare.
From this calculate dry matter according to figures in the tables.
Nutrients in kg can be calculated from this.
How to calculate what nutrients you are recycling back into your soil
Crop
Sunn hemp


