


 51 / 146

45
GRAANGIDS
2017
GRAIN GUIDE
Yield maps
Self-propelled combine harvesters are now relatively commonly equipped with yield monitors. As
the harvester harvests, the yield is captured at GPS points on the on-board computer. This data
can be downloaded to a computer programme, which indicates the yield differences in different
colours. Yield data can be processed further to indicate zones with higher and lower yield in
different colours. These digitals maps can, in turn, be loaded onto GPSs to navigate to patches
with poorer yield. The cause of the poorer yield can be investigated and steps can be taken
to correct these if possible. Prescription maps can then be written from here to the differential
equipment on agricultural implements.
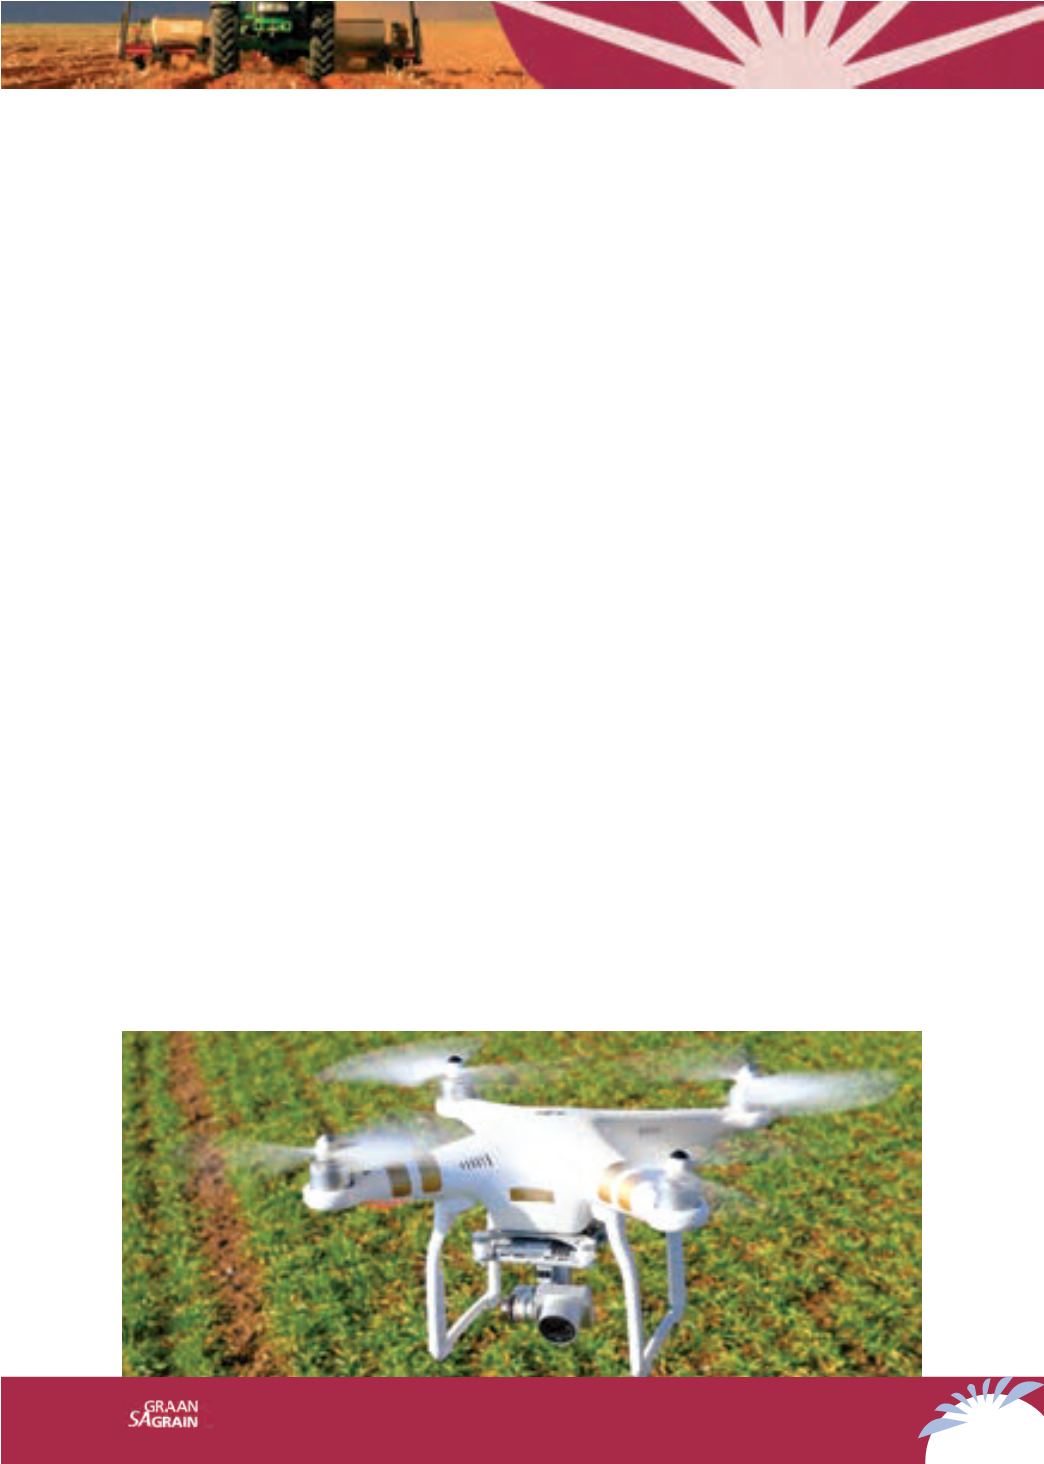
Remote sensing
Satellite images and low-altitude images taken with drones are used increasingly in agriculture.
They are used with particular success in intensive crops like orchards. Producers must only ensure
that this data contains GPS co-ordinate data (ground proofing), otherwise this is just a pretty
picture of the relevant field. Applications are not yet in common use in dryland grain production,
but are more successful in grains under irrigation. The art is to ‘translate’ the numerical values
of the data squares (pixels) to crop growth differences. A data square is a square on a digital
map and also a geographical square. Four corners of the data square contain the geographical
co-ordinates on the basis of a specific size, e.g. 50 cm x 50 cm or 5 m x 5 m, with a single value
or different values included. A digital map consists of a large number of such data squares. These
are converted to a valuable application map with the aid of mathematical correlations and a GIS
programme. For this, a specific value in a data square must be correlated with an agronomic
observation like grain yield. Because vegetation is influenced by such a complex set of factors,
such correlations are something of a challenge. The next challenge is to process the enormous
amount of data for large areas. The integration of high levels of agronomic, geographical and
computer expertise is required for this.
Conclusion
The delivery of precision services requires high-level expertise and skill. It also involves the
integration of soil, agronomic and geographical knowledge and skills to produce an integrated
product. The final product must be able to quantify the proven aspects of the crop production
process in order to increase the biological productivity and the profitability and reduce the
risks and pollution. In the end the financial outlay for the service must be covered by increased
profitability. Good quality precision services usually involve excellence.
Martiens du Plessis, manager: Precision Farming, NWK Limited, and
Eduard Hoffman, chairperson: Department of Soil Science, Stellenbosch University