


 89 / 116

87
March 2018
Soybean
wheat
maize
Soybean
sunflower
maize
Soybean
winter cover crop mix
maize
Soybean
wheat
sugar bean
maize
The winter cover crop mix included rye,
wheat, vetch, radish, saia, turnips and oats.
Table 3
shows the history of the crop se-
quencing treatments since the trial com-
menced with soybean as the first crop on all
the plots. In June 2016 rotation treatments
two and three were planted with wheat and
treatment five with a winter cover crop mix.
The cover crop mix was terminated in
September 2016 and the wheat was harvest-
ed in December the same year. Sequencing
of maize on treatments one and five, and
sunflower on treatment four, followed in
November 2016.
In rotations two and six sunflower and
sugar bean were planted in January last
year as catch crops. Harvesting of the sugar
bean and other summer crops took place
between May and June last year.
The combined crop yields of the two locali-
ties are summarised in
Table 4
(page 89).
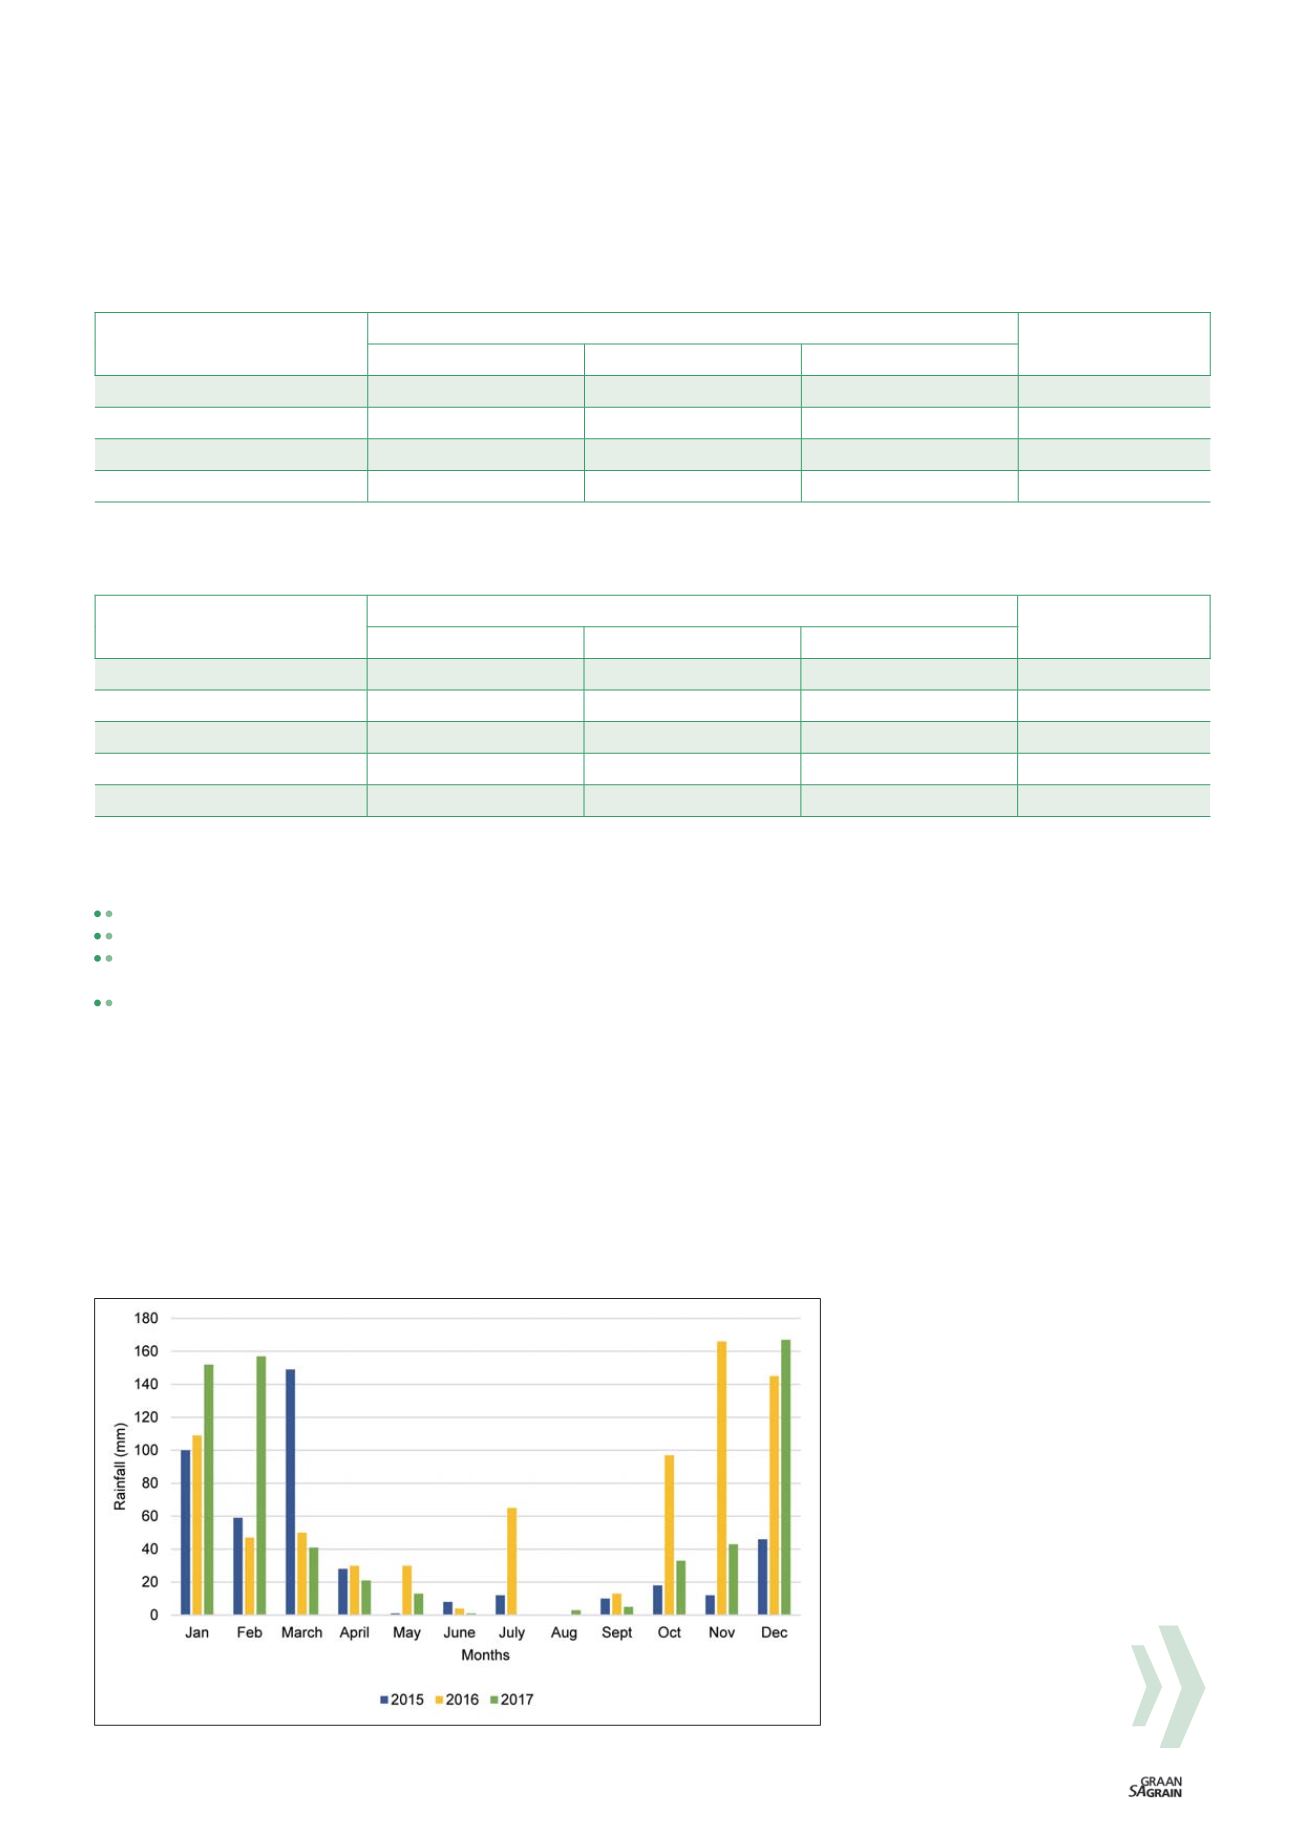
Lower total rainfall until June 2016 had a
huge impact on soil moisture and reflected
negatively on yields – especially in rotation
systems two and six with the catch crops.
Although systems one and four had a fallow
period of five months, the soybean stubble
did not contribute much towards moisture
preservation.
According to the Food and Agriculture
Organisation of the United Nations (FAO),
maize needs 500 mm to 800 mm water per
total growing period in comparison to sun-
flower that needs 600 mm to 1 000 mm per
total growing period.
During the same growing period, a maize
yield of 7,06 t/ha was recorded in system
one, while a lower than average yield of
1,47 t/ha was recorded for sunflower in
system four. That is an indication of insuf-
ficient water availability for the sunflower
crop. The average maize yield of 7,22 t/ha
obtained in system five after soybean and a
cover crop mix, compared favourably with
the 7,06 t/ha maize yield in system one.
Valuable data were obtained, in spite of
difficult weather conditions and several
challenges with weed control in the rota-
tion trials. Plantings for the 2017/2018 sea-
son were established successfully and
will be used as demonstrations during
the
Landbouweekblad
conference in March
this year.
PLANT POPULATION
ROW WIDTH (CM)
AVERAGE
50
76
100
40 000
7,84
7,42
6,15
7,14
60 000
8,03
8,09
6,99
7,70
80 000
9,25
7,44
6,57
7,75
Average
8,37
7,65
6,57
7,53
TABLE 1: MAIZE YIELD (12,5% MOISTURE) T/HA.
TABLE 2: SOYBEAN YIELD (T/HA).
LSD (plant pop. X row width [0,05]): 2,60 LSD (plant pop [0,05]): 1,50, LSD (row width[0,05]): 1,50, cv: 20%
LSD (plant pop. X row width [0,05]): 1,09, LSD(plant pop [0,05]): 0,63, LSD(row width [0,05]): 0,55, cv: 22%
PLANT POPULATION
ROW WIDTH (CM)
AVERAGE
50
76
100
150 000
2,53
2,36
3,46
2,78
250 000
3,13
2,97
2,75
2,95
350 000
2,47
3,02
3,60
3,03
450 000
3,11
3,35
2,32
2,93
Average
2,81
2,93
3,03
2,92
Graph 1: Monthly rainfall measured at VKB silo from January 2015 to December 2017.