


 39 / 73

ႅႋ
CHAPTER 1
4 000 000
3 500 000
3 000 000
2 500 000
2 000 000
1 500 000
1 000 000
500 000
0
-500 000
1917/1918
1921/1922
1925/1926
1929/1930
1933/1934
1937/1938
1941/1942
1945/1946
1949/1950
1953/1954
1957/1958
1961/1962
1965/1966
1969/1970
1973/1974
1977/1978
1981/1982
1985/1986
1989/1990
1993/1994
1997/1998
2001/2002
2005/2006
2009/2010
2013/2014
Hectares
Tons
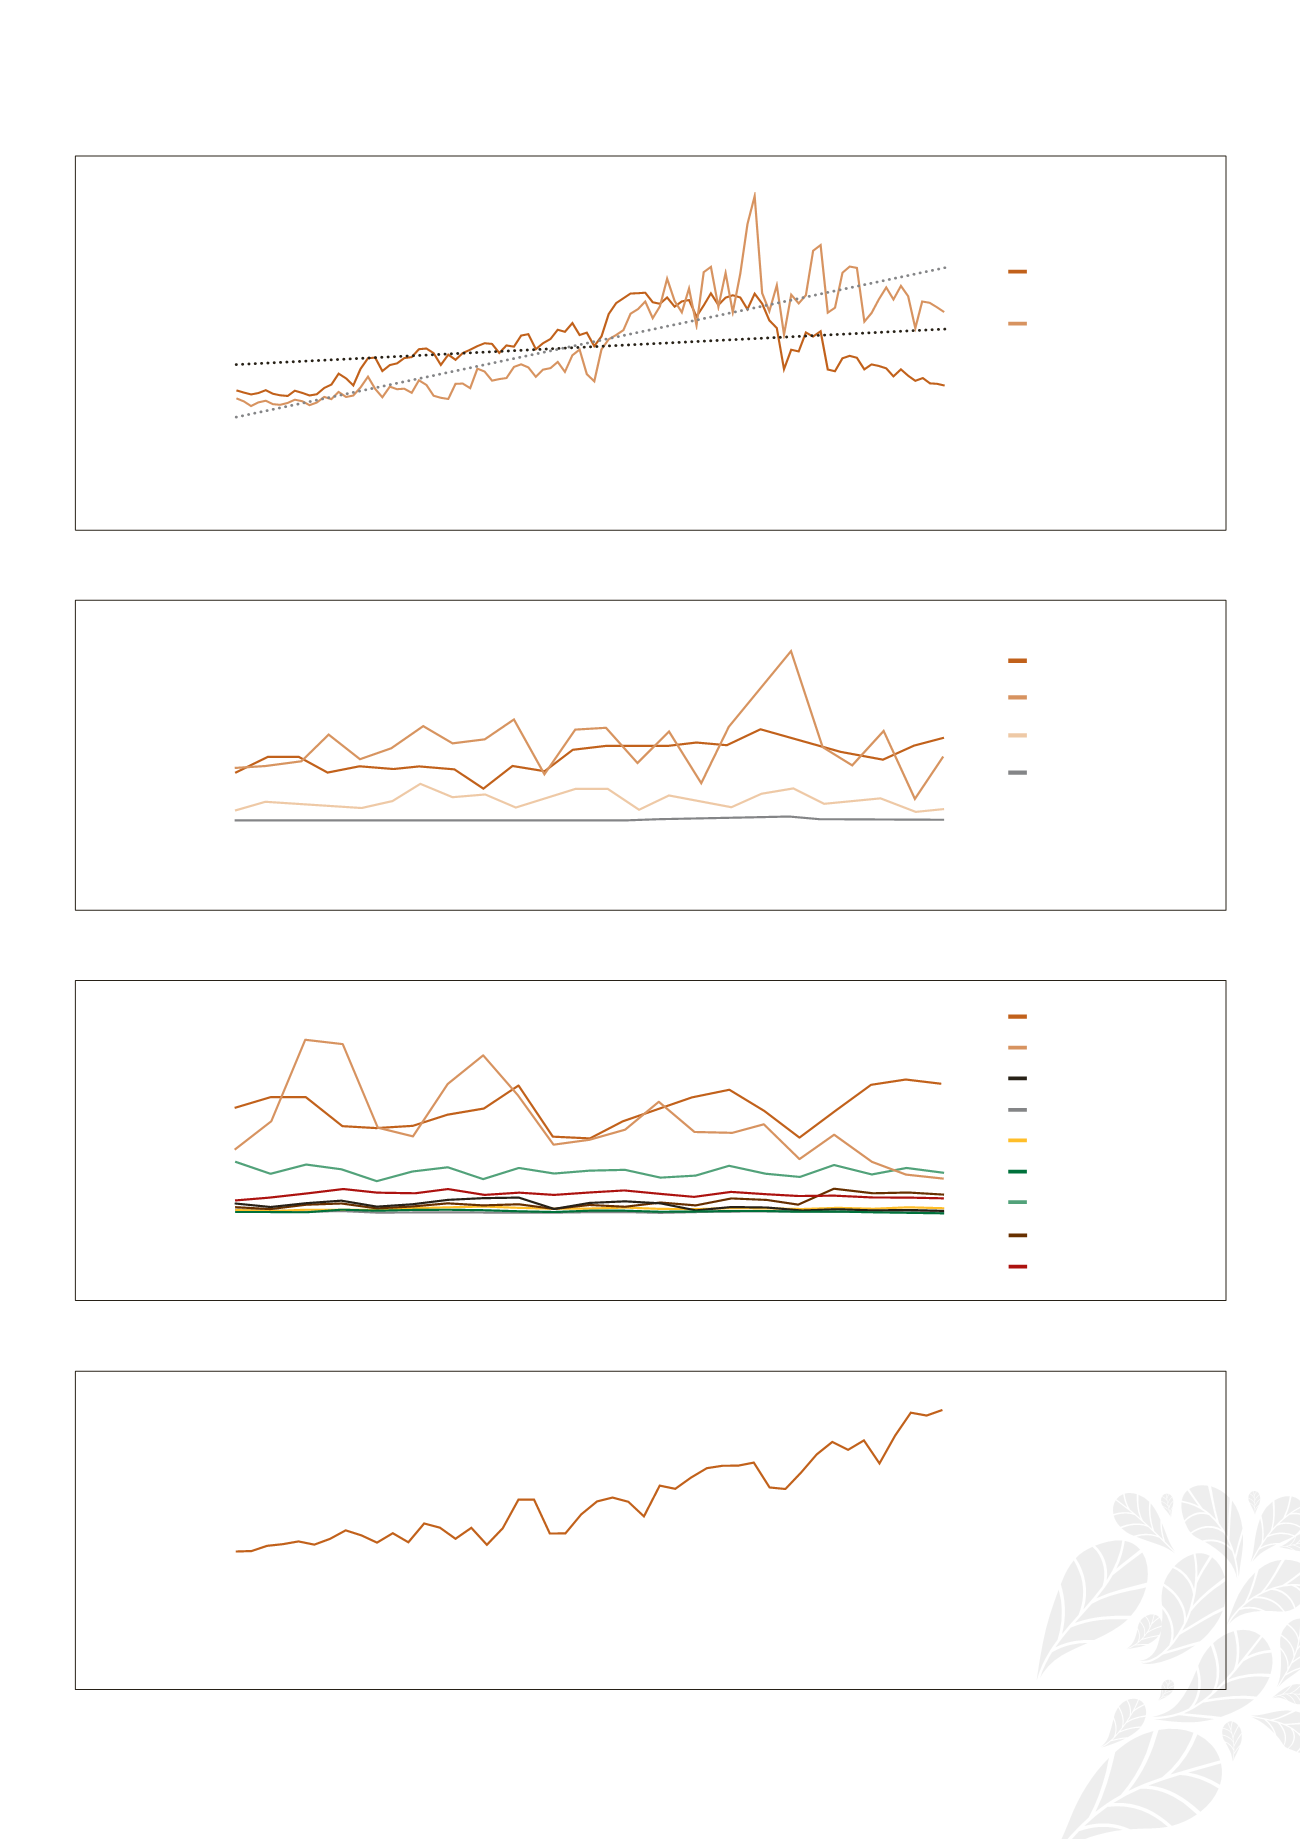
Graph 12: Wheat production in South Africa
2 500
2 000
1 500
1 000
500
0
Tons (thousand)
1970
1971
1972
1973
1974
1975
1976
1977
1978
1979
1980
1981
1982
1983
1984
1985
1986
1987
1988
1989
1990
1991
1992
1993
Graph 13: Wheat production per province
Free State
Cape Province
Transvaal
Natal
1 400
1 200
1 000
800
600
400
200
0
Tons (thousand)
1994
1995
1996
1997
1998
1999
2000
2001
2002
2003
2004
2005
2006
2007
2008
2009
2010
2011
2012
2013
2014
Graph 14: Wheat production per province since 1994
Western Cape
KwaZulu-Natal
Mpumalanga
Northern Cape
Free State
Gauteng
Eastern Cape
Limpopo
North West
4,00
3,50
3,00
2,50
2,00
1,50
1,00
0,50
0,00
Ton/ha
1917/1918
1919/1920
1921/1922
1923/1924
1925/1926
1927/1928
1929/1930
1931/1932
1933/1934
1935/1936
1937/1938
1939/1940
1941/1942
1943/1944
1945/1946
1947/1948
1949/1950
1951/1952
1953/1954
1955/1956
1957/1958
1959/1960
1961/1962
Graph 15: Average wheat yield per hectare since 1917