


 15 / 73

ႃႇ
CHAPTER 1
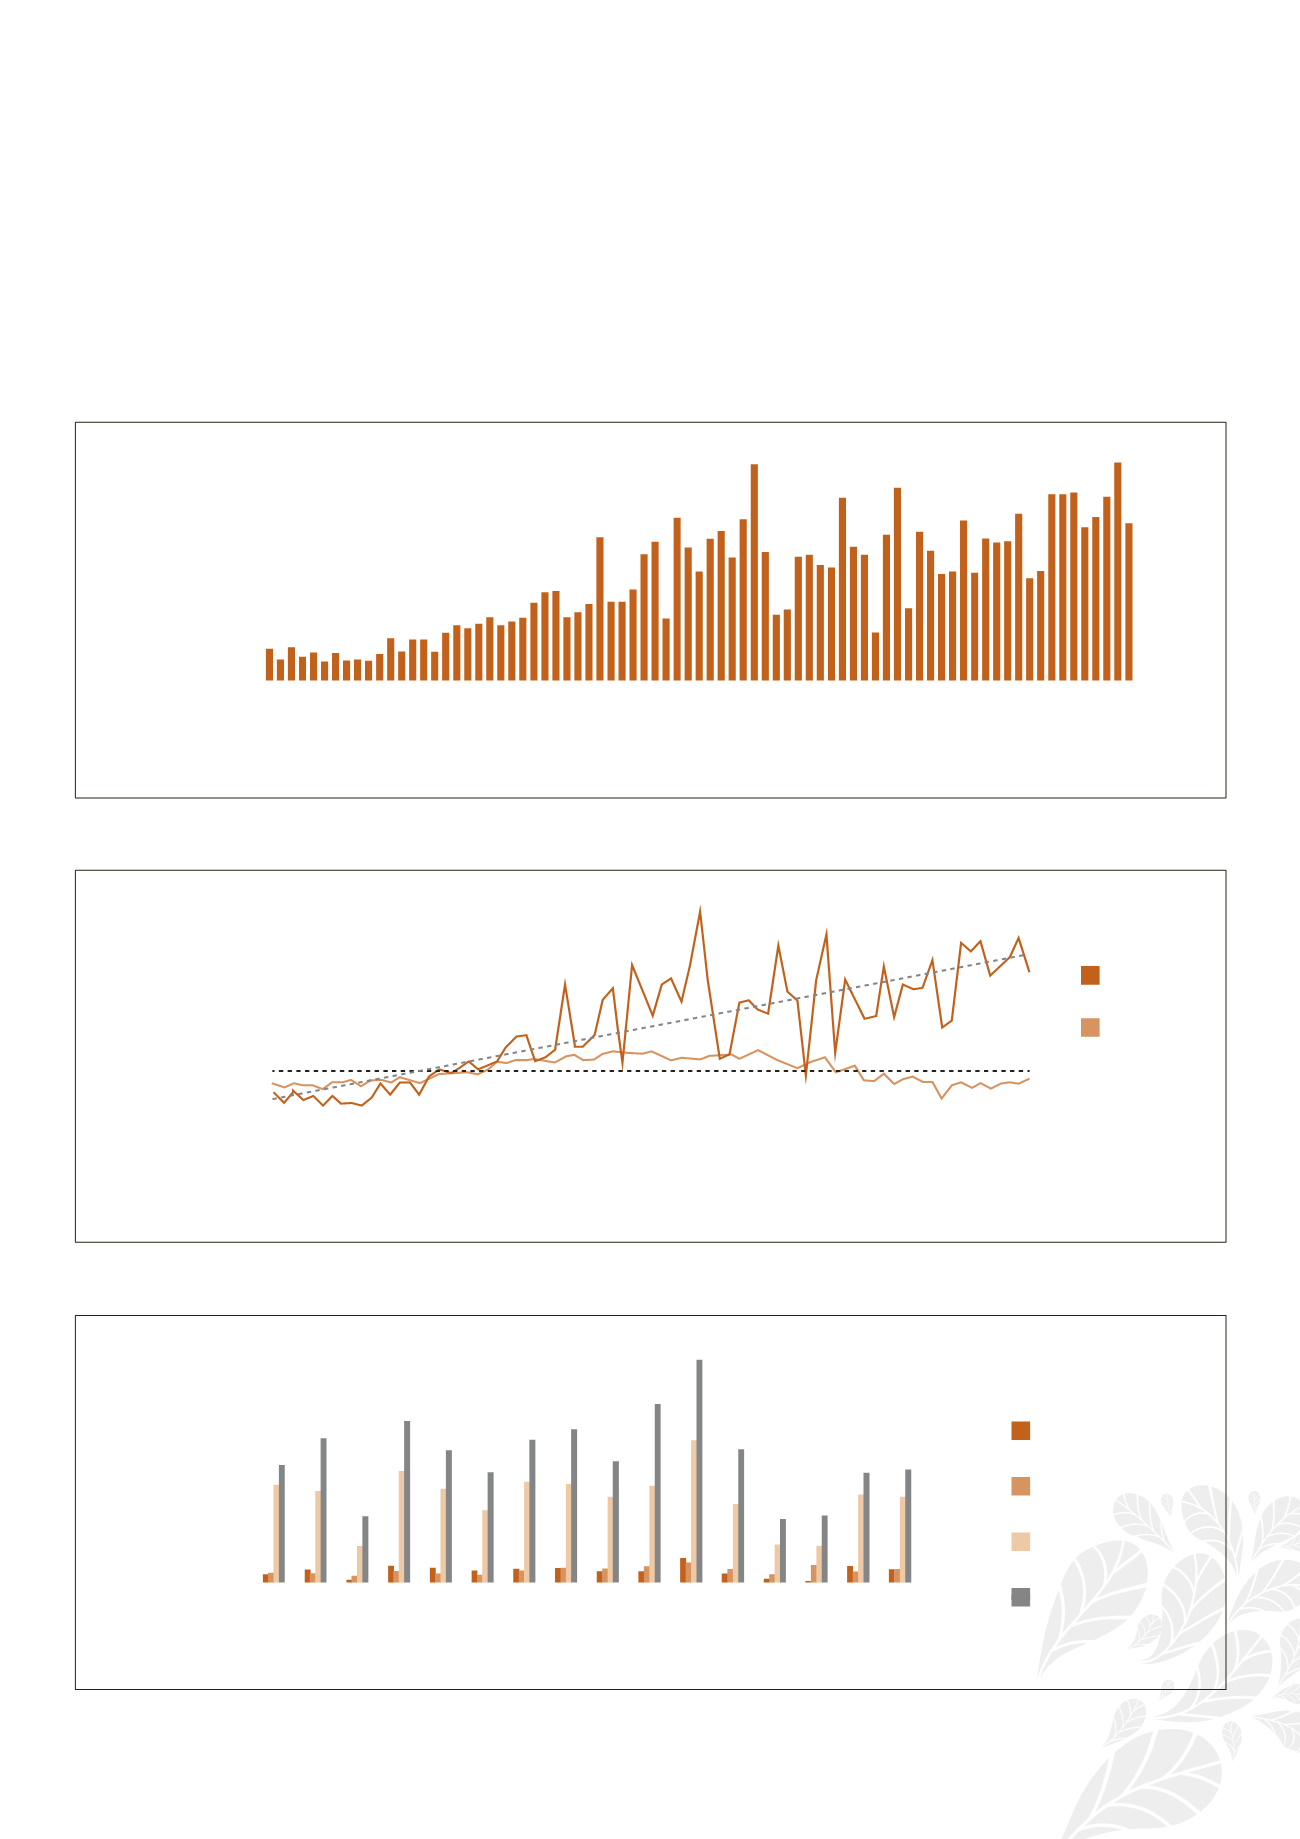
Southern African population. Graph 7 provides an overview of the history of maize
cultivation in South Africa since the 1936/1937 season in terms of the number of
hectares cultivated and the total yield/year.
As shown in Graphs 8 and 9, from 1970/1971 the production of maize was distrib-
uted between the provinces of South Africa.
Approximately 50% of South Africa’s domestic consumption of maize is for human
needs, as is demonstrated by the above statistics (see Graph 10).
16 000 000
14 000 000
12 000 000
10 000 000
8 000 000
6 000 000
4 000 000
2 000 000
0
Tons
1936/1937
1939/1940
1942/1943
1945/1946
1948/1949
1951/1952
1954/1955
1957/1958
1960/1961
1963/1964
1966/1967
1969/1970
1972/1973
1975/1976
1978/1979
1981/1982
1984/1985
1987/1988
1990/1991
1993/1994
1996/1997
1999/2000
2002/2003
2005/2006
2008/2009
2011/2012
2014/2015
Graph 6: Maize production in South Africa
16 000 000
14 000 000
12 000 000
10 000 000
8 000 000
6 000 000
4 000 000
2 000 000
0
1936/1937
1939/1940
1942/1943
1945/1946
1948/1949
1951/1952
1954/1955
1957/1958
1960/1961
1963/1964
1966/1967
1969/1970
1972/1973
1975/1976
1978/1979
1981/1982
1984/1985
1987/1988
1990/1991
1993/1994
1996/1997
1999/2000
2002/2003
2005/2006
2008/2009
2011/2012
2014/2015
Graph 7: Maize production in South Africa – maize plantings and yield
Tons
Hectares
9 000
8 000
7 000
6 000
5 000
4 000
3 000
2 000
1 000
0
Tons (thousand)
1970/1971
1971/1972
1972/1973
1973/1974
1974/1975
1975/1976
1976/1977
1977/1978
1978/1979
1979/1980
1980/1981
1981/1982
1982/1983
1983/1984
1984/1985
1985/1986
Cape Province
Free State
Natal
Transvaal
Graph 8: Maize production per province